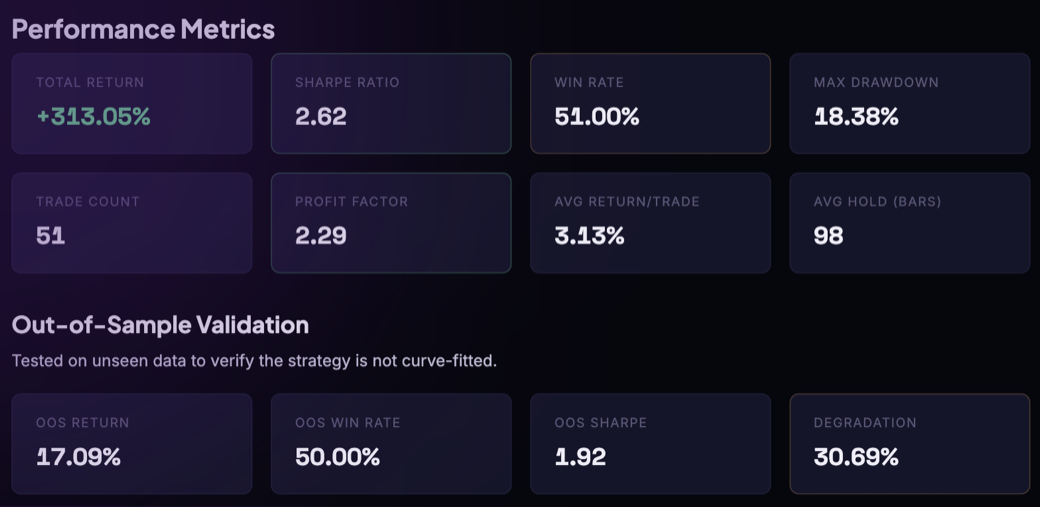
We Ran Our Own Strategy Library Through a Validation Gauntlet — Here's What Survived
Most trading platforms show you the winning backtest. The chart goes up and to the right, the Sharpe ratio is flattering, and the thousands of variants that died on the way to that screenshot are nowhere to be seen.
This article is about the graveyard. Not because failure is interesting for its own sake, but because the graveyard is the only place you can verify whether a validation process actually rejects anything — including, when the tests get better, the platform's own published work.
Over ten weekly discovery runs we can fully reconstruct, our engine evaluated 8,610 strategy candidates. 36 passed the full validation gauntlet — 0.42%. Of those, 8 were actually published to the library. Then we built a set of harder tests, pointed them at our own already-published strategies, and 10 of the 15 strategies in our live library got flagged.
We're publishing all of it — including the part where we discovered our own engine had a bug that meant it was never searching a third of the strategy families it claimed to.
The gauntlet, in plain language
Every candidate strategy — a rule set, on one coin, on one timeframe — has to survive a sequence of filters. When a strategy fails, it fails a named filter, and each filter exists to protect you from a specific way backtests lie:
Sanity gates. Enough trades to mean anything (minimum 30), a drawdown cap of 35%, and a minimum risk-adjusted return. Boring, and responsible for most of the killing — more on that below.
Walk-forward. A backtest can memorize the past. Walk-forward hides part of history from the strategy, then checks how it performs on the part it never saw. We require it to keep at least 50% of its performance on unseen data — if it can't, the pretty backtest number was luck, and we say so.
Trade-sequence bootstrap. Your backtest shows one version of history. We replay a strategy's trades in 500 shuffled orders — 500 alternate universes — and look at the worst that could plausibly have happened. If 1-in-20 universes produces a drawdown that would make you quit, you should know that before real money is involved. The same test also catches the opposite: a strategy whose real history was luckier than nearly all of its own reshuffles.
Plausibility cap and divergence bound. If a strategy scores too perfectly, we reject it — in our experience, "unbelievable" results are almost always a data error or luck, not a discovery. And if its practice-run score and its unseen-data score disagree wildly in either direction, we flag it: you can't trust either number.
Breadth. A strategy that only ever worked on one coin is probably a story about that coin, not a strategy. When the same rules independently survive on many assets, that's evidence the edge is real.
The funnel, with the awkward parts left in
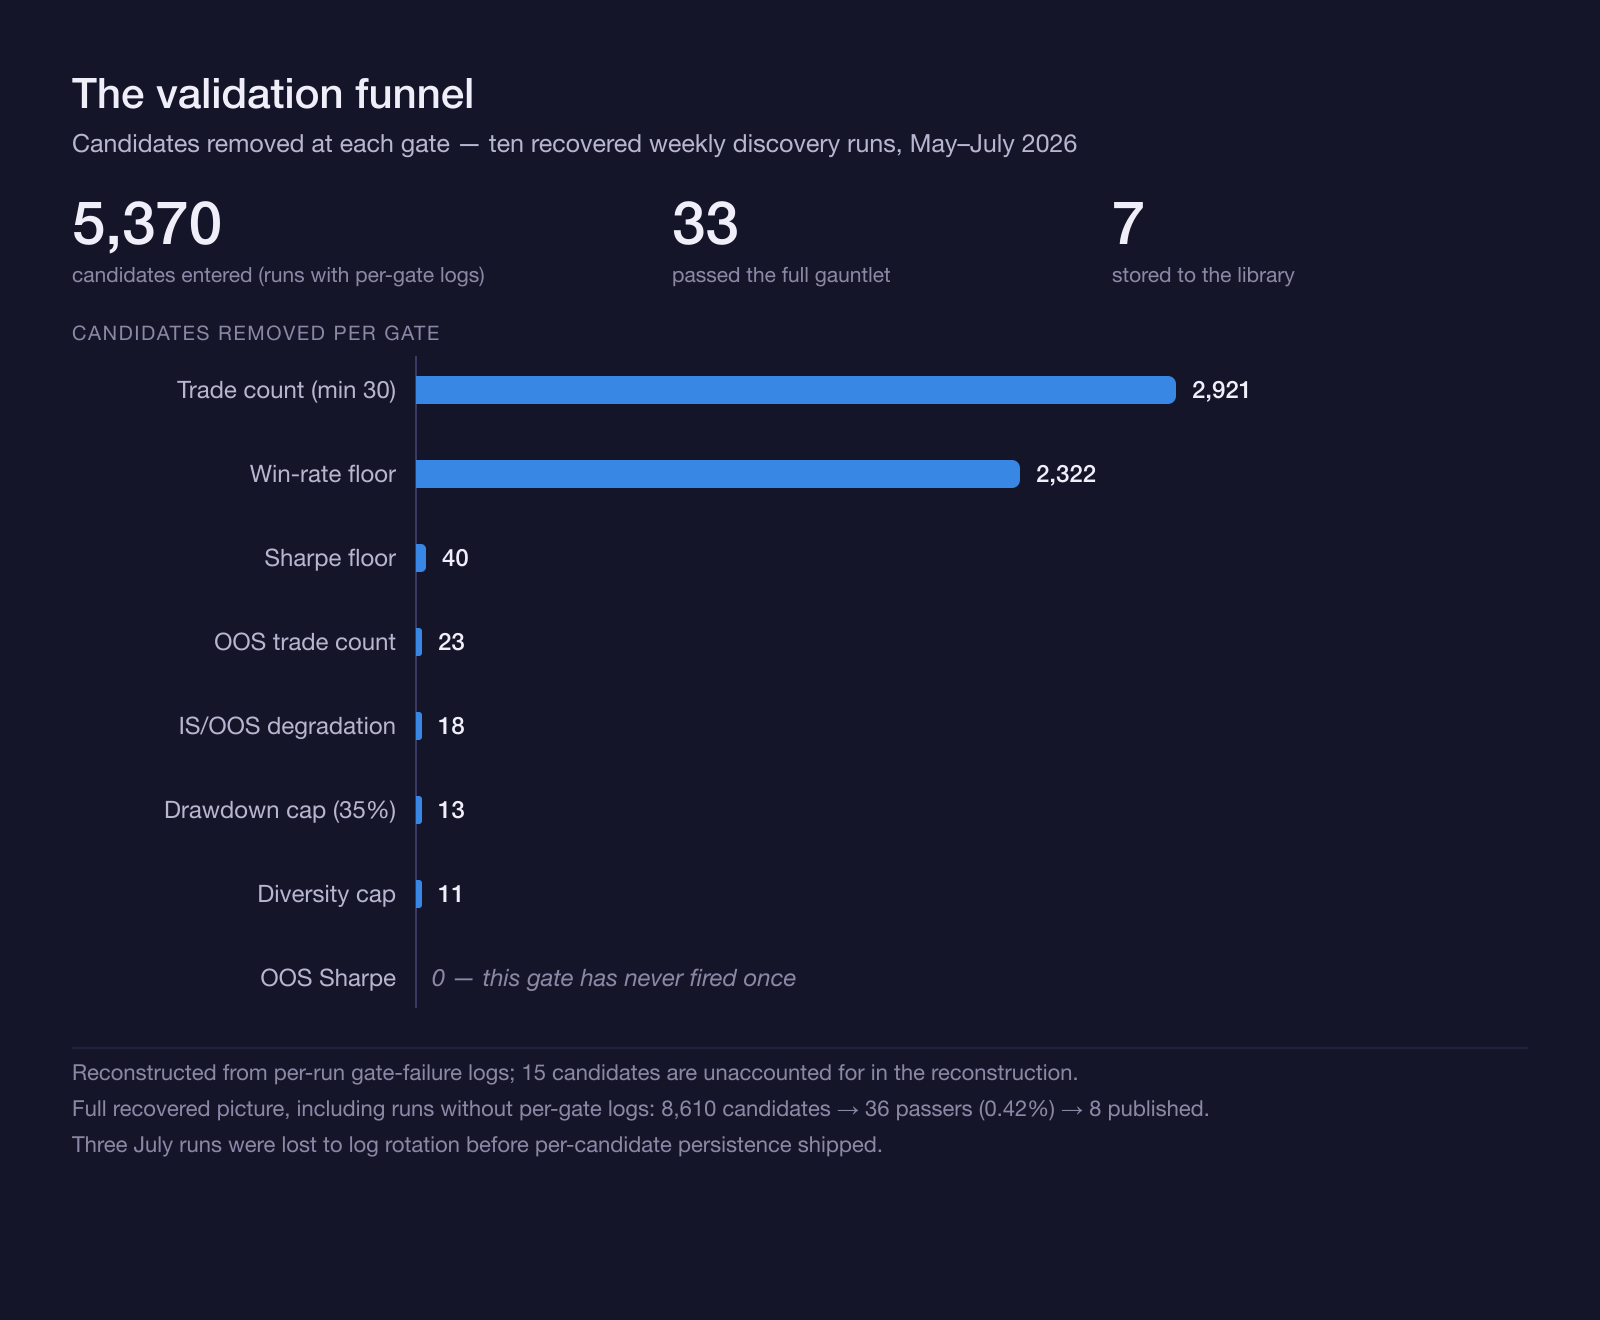
Across the ten recovered runs: 8,610 candidates, 36 full-gauntlet passers (0.42%), 8 published. Counting only what actually reached the library, survival is 0.09%.
For context, a well-known public strategy-validation funnel — the kind of "we tested thousands of backtests" analysis that circulates on YouTube — passes roughly 5.7% of its candidates. Depending on whether you compare our gauntlet passers or our actual publications, our funnel is 8 to 60 times stricter. We're not claiming that makes us smarter. It makes us pickier, and it means the strategies that do carry our validation badge earned it against a filter most survivorship-biased marketing never faces.
Two awkward findings inside that funnel:
Almost everything dies at the door. 5,243 of the 5,370 candidates with detailed logs — 97.6% — were removed by the two most basic gates (too few trades, win rate below threshold) before the sophisticated out-of-sample machinery ever saw them. One of our out-of-sample gates has, to date, never fired once. A gauntlet where the fancy gates are underemployed is a gauntlet whose shape needs work, and rebalancing it is exactly what the next section is about.
Three weeks of history are gone. Our July 12, 19, and 26 runs were lost to log rotation before we thought to preserve per-candidate results — for rejected candidates, no metrics were being stored anywhere. Everything above is reconstructed from the runs we could recover, and we've since shipped persistence so every future candidate's numbers survive whether it passes or not. When we say "reconstructed," treat the figures as exactly that.
The confession: we weren't even searching a third of the map
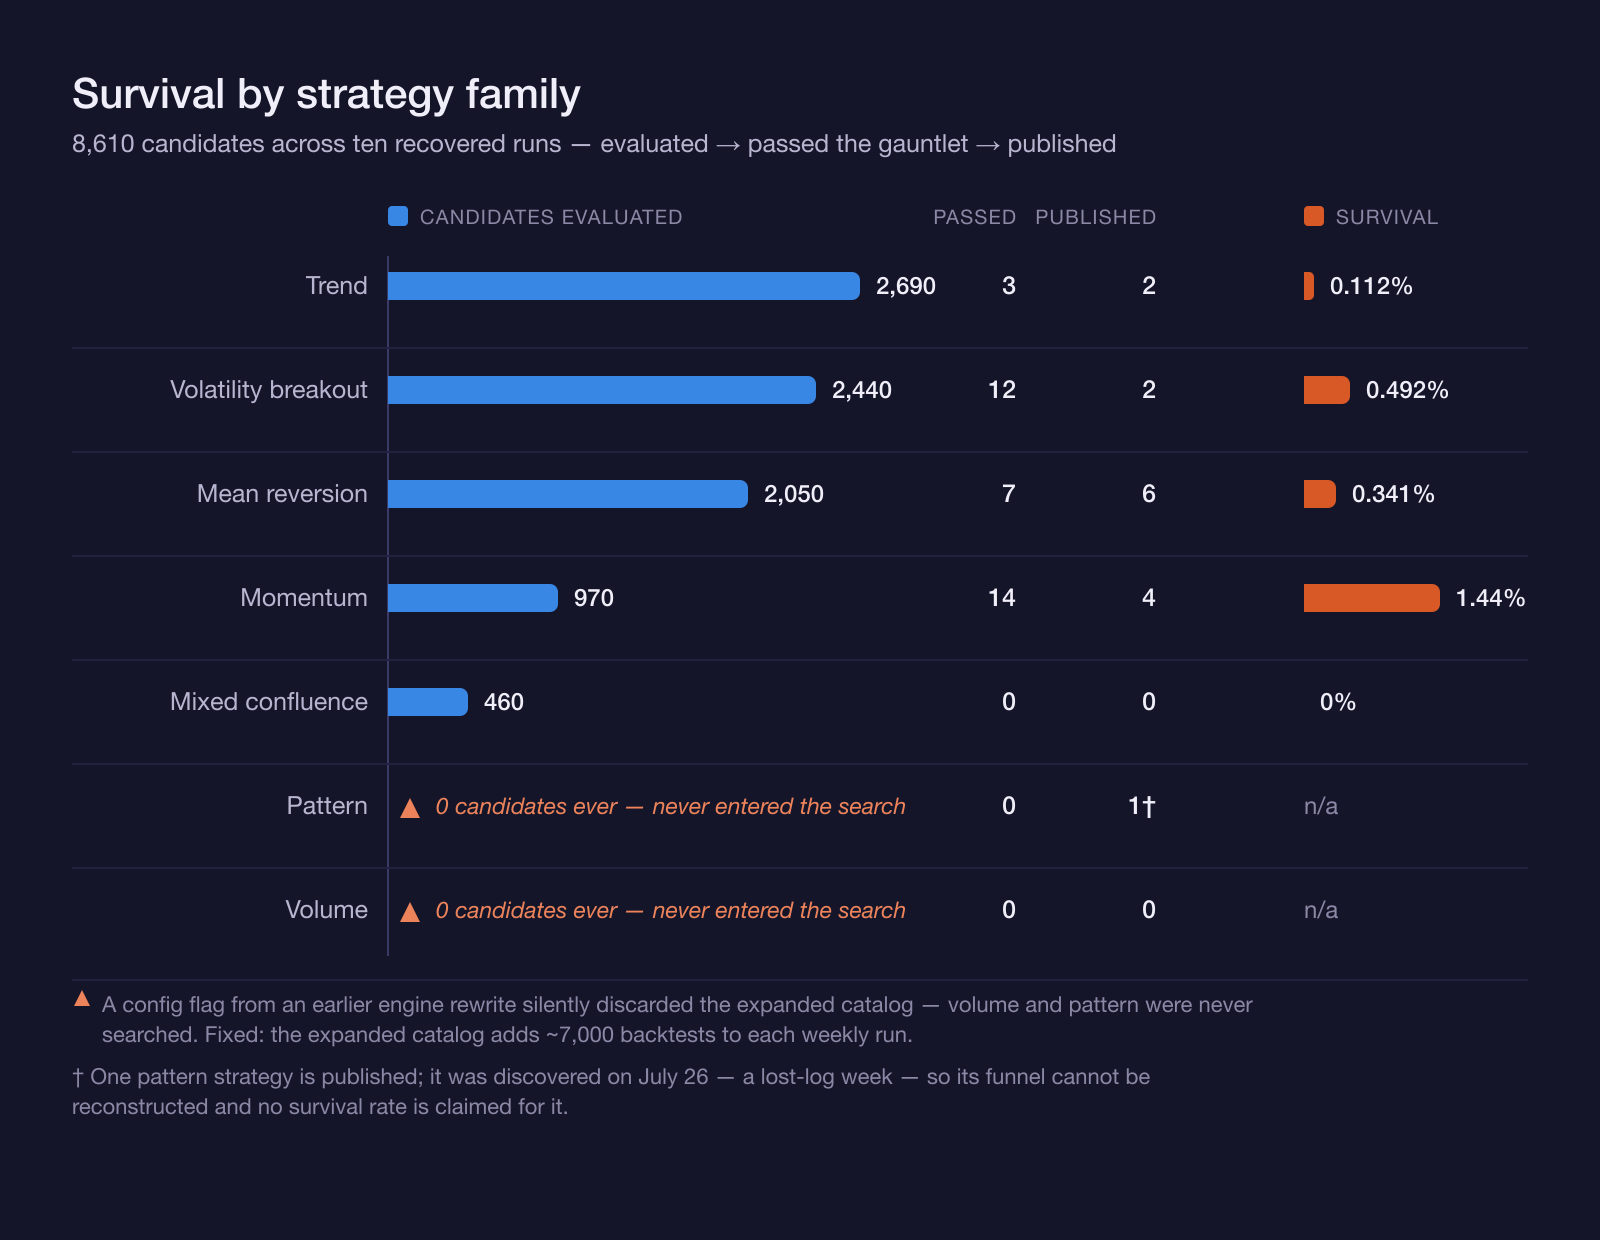
When we aggregated survival by strategy family, two families — volume and pattern — showed zero candidates. Ever.
That wasn't the market's verdict. It was a bug: a configuration flag introduced during an earlier engine rewrite silently discarded our expanded strategy catalog, so the weekly discovery cron kept searching an old hardcoded list. Two of our six strategy families were never entered into the race, and nothing in our monitoring said so. We found it because the family-survival table made the hole impossible to ignore — which is a decent argument for building the table. The wiring is fixed; the expanded catalog adds roughly 7,000 backtests to each weekly run.
(One pattern-family strategy is currently published. It was discovered on July 26 — one of the weeks whose logs we lost — so we cannot reconstruct the funnel it came through. That caveat stays attached to it.)
The rest of the family table is humbling in the ordinary way: mixed confluence — the "combine several indicators" family that sounds most sophisticated — went 0 for 460. Momentum had the best survival rate at 1.44%. Nothing cleared 2%.
Then we pointed the new gates at ourselves
The harder question: do our own published strategies survive the tests we just built? We replayed the full 15-strategy library through the three new gates. 10 of 15 were flagged.
- Walk-forward floor: 1 failure. One strategy kept only 42.5% of its performance on unseen data, below our 50% floor — and well below the next-lowest in the library at 81.3%. It's flagged for audit.
- Bootstrap: 6 flagged. Four had a 1-in-20 reshuffled drawdown worse than our 35% cap (up to 38.1%). Four were the opposite problem — lucky tails: one strategy's real history was shallower than 98 out of 100 of its own reshuffles (percentile 1.9), meaning its live record flatters what the same trades would typically deliver. Two strategies hit both flags.
- Divergence bound: 4 flagged — all short-direction strategies whose unseen-data scores were roughly double their practice scores (e.g. 2.72 vs 1.24). Too good is also a flag: those out-of-sample windows sat in the first-half-2026 altcoin weakness, so a regime gift is doing work the strategy will not repeat on demand.
Notably, the three gates caught different strategies — the walk-forward failure is bootstrap-clean, and the bootstrap failures pass walk-forward. No single test would have found them all.
None of these were silently unpublished. Every flag goes to a human audit with the evidence attached, and users running bots on anything that gets unpublished will be notified directly. That's policy, not mood.
What the reshuffles taught us about losing streaks
While rebalancing the gates, we ran a fresh forward simulation — 1,620 backtests across our discovery universe — to test whether the crude win-rate gate could be replaced by the bootstrap band. Two findings worth your time:
The bootstrap band is the sharper instrument. Of the candidates only the win-rate gate was blocking, the bootstrap band independently killed 8 of 9 — and it also fails 5 of the 9 strategies that pass today's full gauntlet. Enforcing it shrinks the library before anything grows it. We're doing it anyway, sequenced through the audit, because a smaller honest library beats a larger fragile one.
Losing streaks are a feature of the math, not a malfunction. Among the survivors with win rates of 39.6–43.1%, the maximum losing streaks were 6, 6, 6, 7, and 11 consecutive losses. If you run a ~40%-win-rate strategy, a 6-to-11-loss streak is the expected experience. We will display that number next to low-win-rate strategies, and runtime circuit breakers (consecutive-loss and time-windowed loss limits) default on for them — the honest alternative to letting you discover the streak with real money.
Scope honesty: that simulation is one time window, two of three timeframes, legacy strategy list only. Its headline counts carry wide uncertainty; its directional conclusions were checked against the historical funnel and hold.
What happens next
- The audit. The 10 flagged strategies go through our monthly library audit — human decision per strategy, evidence on the table, no silent removals. If a strategy comes off the shelf, anyone running a bot on it hears it from us directly, before they notice it in the interface.
- Monthly re-gauntlet. The full library replay is now a standing part of that audit. A badge earned in June must be re-earned in August; market regimes change and validation has a shelf life.
- A wider catalog. With the shadowed config fixed, volume and pattern strategies finally enter the race — and the funnel and family charts in this article will be regenerated from the persisted data, not reconstructed from logs.
What this means for you
When a strategy in our library carries the validation badge, it means: it survived a funnel that rejects more than 99% of candidates, it kept at least half its performance on data it never saw, its 500 alternate histories don't contain a ruinous drawdown, and its results were neither too bad nor too good to trust. It also means the badge is revocable — by our own tests, in public, on a schedule.
We can't promise you alpha. Nobody honestly can. What we can promise is that everything we publish has been tried against the same machinery we just used on ourselves — and that when the machinery finds something embarrassing, you'll read about it here first.
All figures in this article come from committed run artifacts and replay jobs — none are hand-assembled. Three July 2026 discovery runs were lost to log rotation before per-candidate persistence shipped; figures for the recovered runs are reconstructed from run logs and marked as such above.
Want Anny's AI to analyze your portfolio? Try the Anny Line or see pricing.