The Strategy Lab: thirty strategies, and at least ten are below our own bar
Here is the number a strategy library is not supposed to print.
On today's re-test (16 August 2026), at least 10 of the 30 strategies in the Anny Strategy Lab fall below one or more of the thresholds we require for publication. They are still on the page. They are still copyable. The failing numbers are shown on each one.
"At least" is doing real work in that sentence. The daily re-test recomputes six of the seven gates below — trades, win rate, Sharpe, drawdown, out-of-sample degradation, out-of-sample Sharpe. The seventh, the out-of-sample trade count, is checked when a strategy is published and is not stored for re-checking. So 10 is a floor, not an exact total, and the honest direction to round is up.
That count moves every day, in both directions. Two days ago it was 18. The strategy page carries the current figure, and that one governs, not this one.
We print it because a library whose numbers only ever improve is a library that isn't re-testing. It's re-printing the day it published.
Here is how it works, gate by gate.
What the search actually rejects
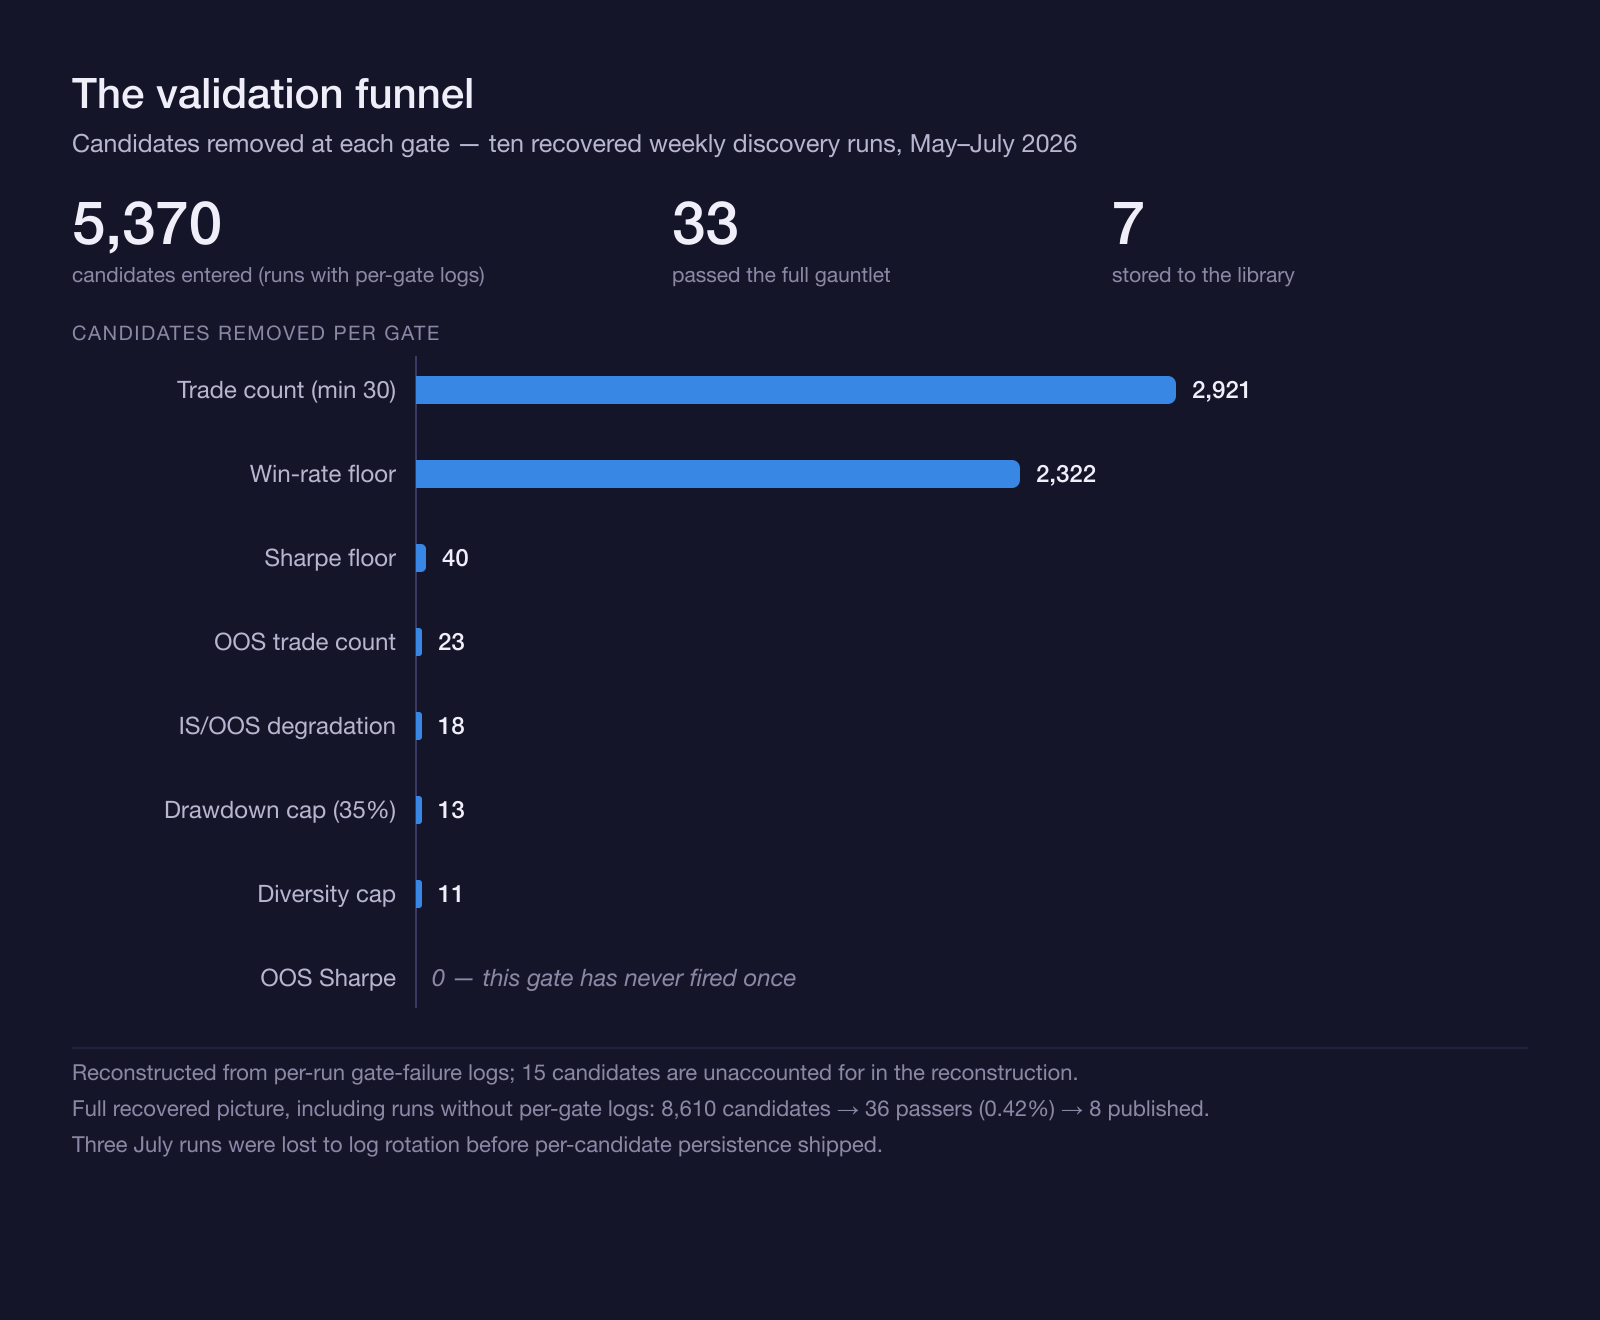
In our most recent recorded sweep, run before 16 August 2026, the Lab backtested 9,385 parameter combinations. Twenty-five of them produced enough trades to be assessed against the quality bar at all. Four were published.
Be precise about what happened to the other 9,360: the overwhelming majority never generated the minimum thirty trades, so there was nothing to judge. That is a mechanical filter, not a verdict that each of them would have lost money. None of them were ever run with real capital, and we are not claiming otherwise.
Sweeps are launched deliberately, by hand, when we decide to run one. There is no schedule and no promise about how often the library grows. The daily part of this system is the re-testing, not the searching.
The bar
To be eligible for publication, a candidate must clear all seven of these:
| Gate | Threshold |
|---|---|
| Closed backtested trades | at least 30 |
| Win rate | at least 40% |
| Sharpe ratio | at least 0.5 |
| Maximum drawdown | no worse than 35% |
| Out-of-sample degradation | no worse than 50% |
| Out-of-sample Sharpe | at least 0.3 |
| Out-of-sample trades | at least 8 |
Every figure above is measured on trades that pay costs. Each side of every trade is charged a 0.1% taker fee plus slippage: 0.1% on majors, 0.3% on everything else. A round trip on an altcoin therefore gives up 0.8% before it can show a profit. Backtests that skip this are how a strategy with a 42% win rate looks viable on a chart and is not viable on an exchange.
Two further floors apply on top: a probabilistic Sharpe ratio of at least 0.6 measured on out-of-sample data, and profitability in at least half of the walk-forward periods.
One honest limitation, since we are quoting a probabilistic Sharpe next to a five-figure candidate count: that probability is not adjusted downward for how many combinations we tested. Search 9,385 candidates and some will clear any fixed bar on luck alone. The held-out sample below is what we rely on to catch that, not the PSR number. Correcting the bar for the size of the search is on our list and is not built yet.
Clearing every gate makes a candidate eligible. It is an entry test, taken once, on the day of publication. What happens afterwards is further down this page.
What "out-of-sample" means here
Each strategy's history is split chronologically. The first 80% is used to find and tune it. The parameter search never reads the final 20% — no candidate's parameters are chosen, scored or ranked using it. The surviving strategy is then run against that untouched final stretch, and if it falls apart there it is not published, however good the first 80% looked.
We also cut the full history into four sequential periods and check the strategy held up across all of them rather than owing its result to one lucky month. To be exact: the parameters stay fixed across all four periods, so what this measures is consistency. Re-optimising inside each window would be walk-forward optimisation, which is a different and stronger claim than the one we are making.
9,385 combinations were tuned on the first 80%. Four were still standing after the final 20%. That gap is what a held-out sample costs a candidate, and what skipping it would have let us publish.
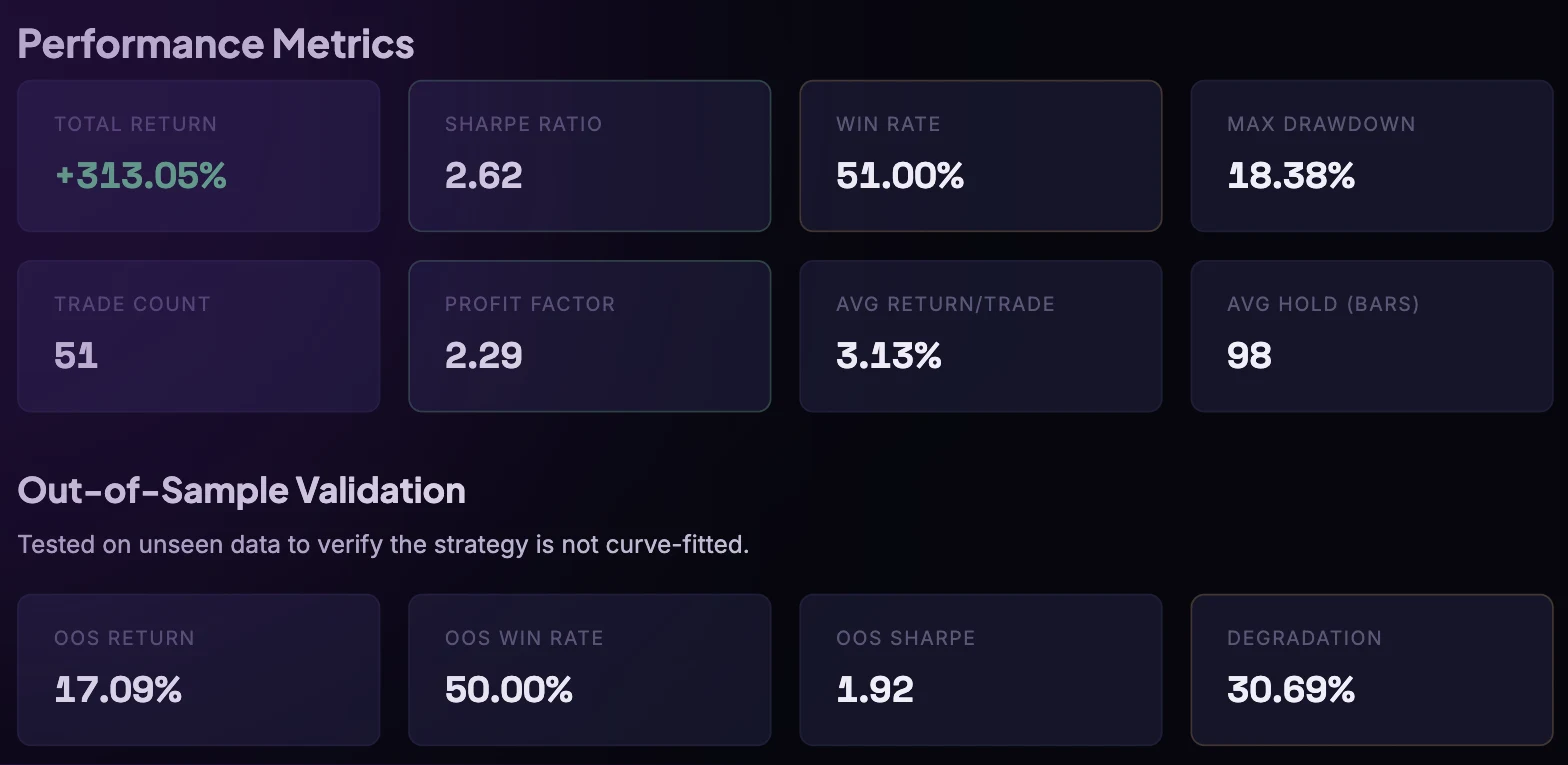
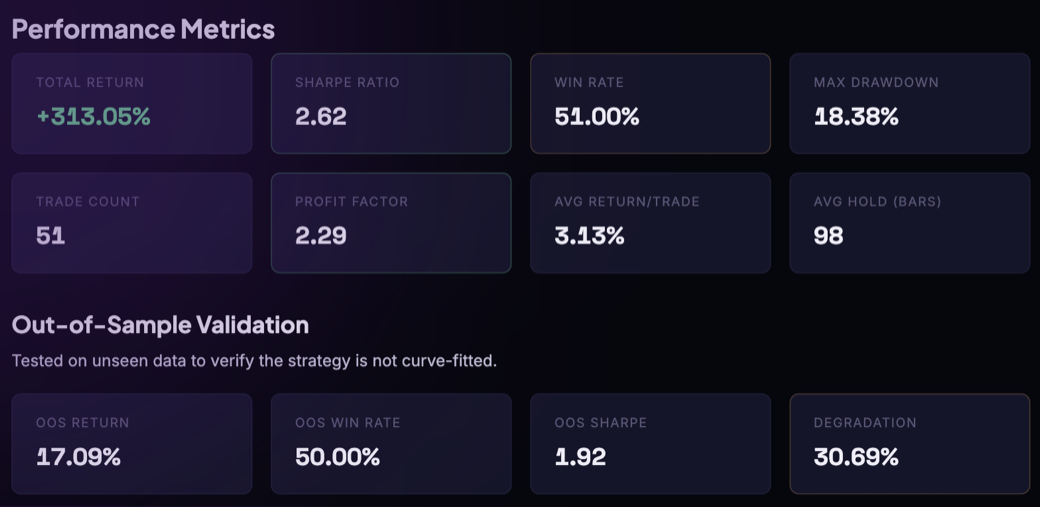
Peak Fader on DOT, as published. The top block is what the strategy did across its full history. The bottom block is the held-out 20% it never saw during tuning, including how far it decayed. Both are on the public page, side by side.
What's in the library today
As of 16 August 2026: 30 strategies, across 15 assets and 14 distinct strategy types. The smallest has 30 closed trades behind it and the average has 45. These are simulated backtest trades, not live trading history.
Every strategy is queued for a re-backtest on fresh market data daily, and the numbers on its page are replaced with whatever that re-test returns. The result is printed even when it is worse than the day we published, which is how a published strategy ends up showing a negative out-of-sample Sharpe in public.
Here is one of them, live on the site right now:
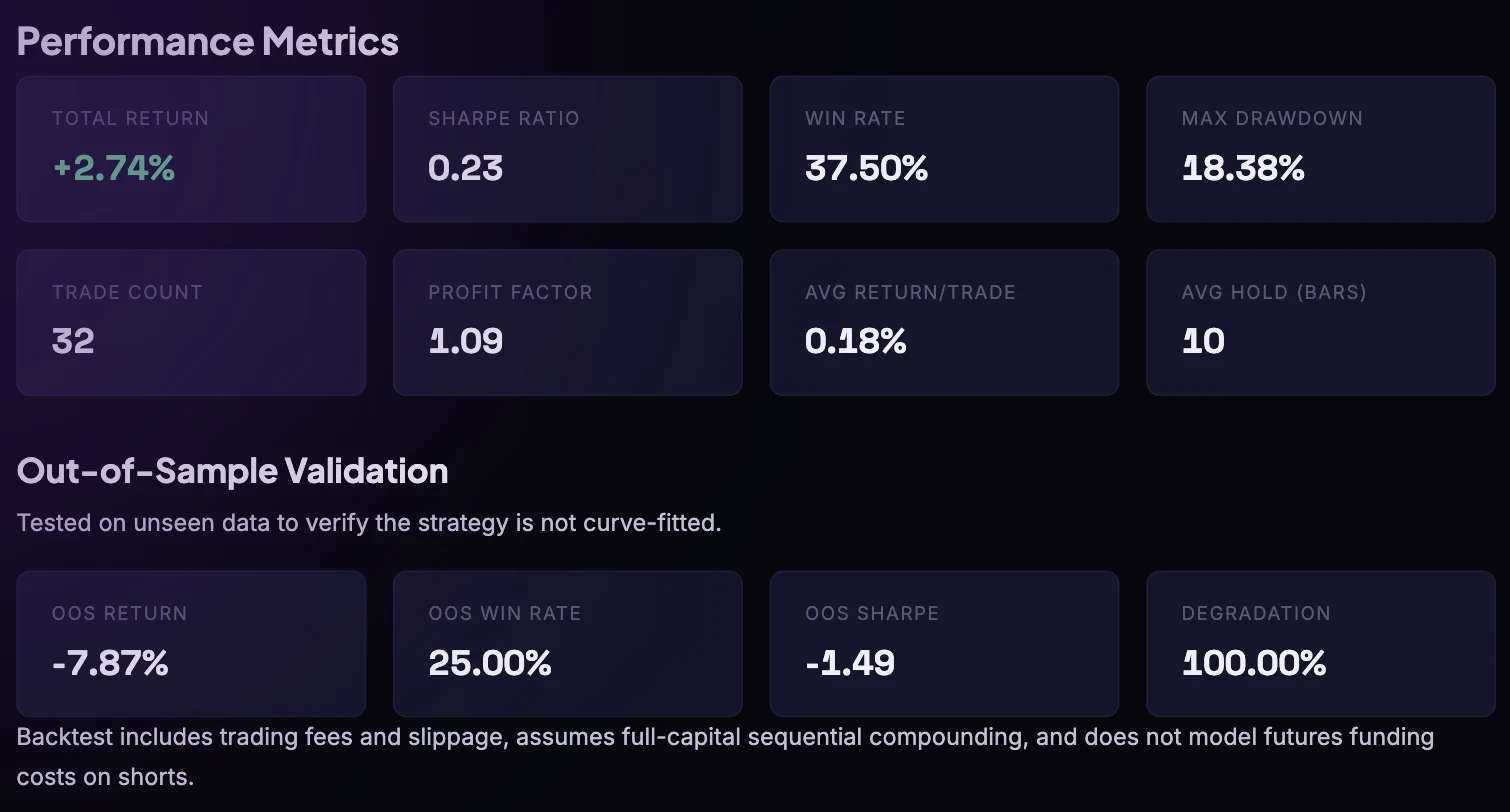
Momentum Rider on SOL. A Sharpe of 0.23 against our 0.5 floor, an out-of-sample Sharpe of −1.49, and degradation pinned at the +100 cap. It is published, it is copyable, and those are the numbers we show for it.
Two things to understand about that:
A flag is not a removal. The daily re-test marks a strategy that has dropped below a gate. It does not withdraw it. A failing strategy stays in the library, still copyable, with its failed gates shown. Retiring one is a decision a person makes deliberately. Treat a flag as a warning you have to act on, not a cleanup we already did for you.
The decay figure is capped. We express degradation against the original backtest as a percentage bounded at ±100, where a positive number means the out-of-sample stretch was worse and a negative number means it was better. A strategy showing +100 has decayed by at least that much and possibly more. Nine of the thirty sit exactly on one end of that cap today: four at +100, five at −100. For those nine the displayed figure understates how far they have actually moved.
The rules stay private, on every plan
You see the metrics that let you judge a strategy: full trade history, equity curve, win rate, drawdown, out-of-sample results, and which market regimes it worked in.
You do not see the exact parameter values. Not on Free, not on Pro, not on Pro Max. Most products in this category sell those numbers at the top tier; ours are withheld at every tier, which is why this section ends without an upgrade button.
Every product surface withholds them, chat and shared links included. If you ever find a path that returns them, tell us and we'll close it.
You can run a strategy without them. Execution is server-side: the rules run on our machines and are never sent to your browser, your bot config, or your exchange account.
What you do with it
- Browse. The whole library is readable by anyone, including people who aren't logged in. This part costs nothing and needs no account.
- Deploy one as a bot. This needs a paid plan, and a paid plan includes all thirty — the ones marked Premium are not a separate purchase. You choose the exchange, the capital and the stop; the rules themselves stay server-side.
- Modify it. Change the position size, the stop, the take-profit, the timeframe. Once you change any of those, the numbers on the page stop describing what you're running. The daily re-test always tracks the unmodified version.
- Add coins. Run the same approach on other assets, with the caveat that every published metric was earned on one asset. On a new coin it is an untested idea until it is backtested there.
- Build a portfolio. Run several bots at once, with a portfolio view that flags when they are all quietly making the same bet, because assets that move together are not diversification.
What it costs
Browsing costs nothing. Running a strategy costs a paid plan and nothing on top of it: no credits are consumed when you copy a strategy into a bot, no per-strategy fee, no marketplace cut.
We built the Lab because the alternative is running a 9,385-combination search on your own hardware to get four answers out of it, with a held-out sample you have to remember to withhold from yourself. Running that search once and giving the survivors to everyone on a plan costs us the same as running it for one person. That is the part Anny and Claude make possible, and it is why it isn't priced separately.
That's the arrangement. We do the rejecting, you get what survived, and you get to see when a survivor starts slipping, including when it goes against us.
The Strategy Lab is research, not financial advice. Anny is not a financial advisor. All figures shown are from backtests on historical data; past backtested performance, including out-of-sample results, is not indicative of future results. Backtests charge exchange fees and slippage as described above but exclude funding costs, and assume a stop-loss fills at its level. Live results will differ. Trade only what you can afford to lose.
Want Anny's AI to analyze your portfolio? Try the Anny Line or see pricing.