

Ask Anny
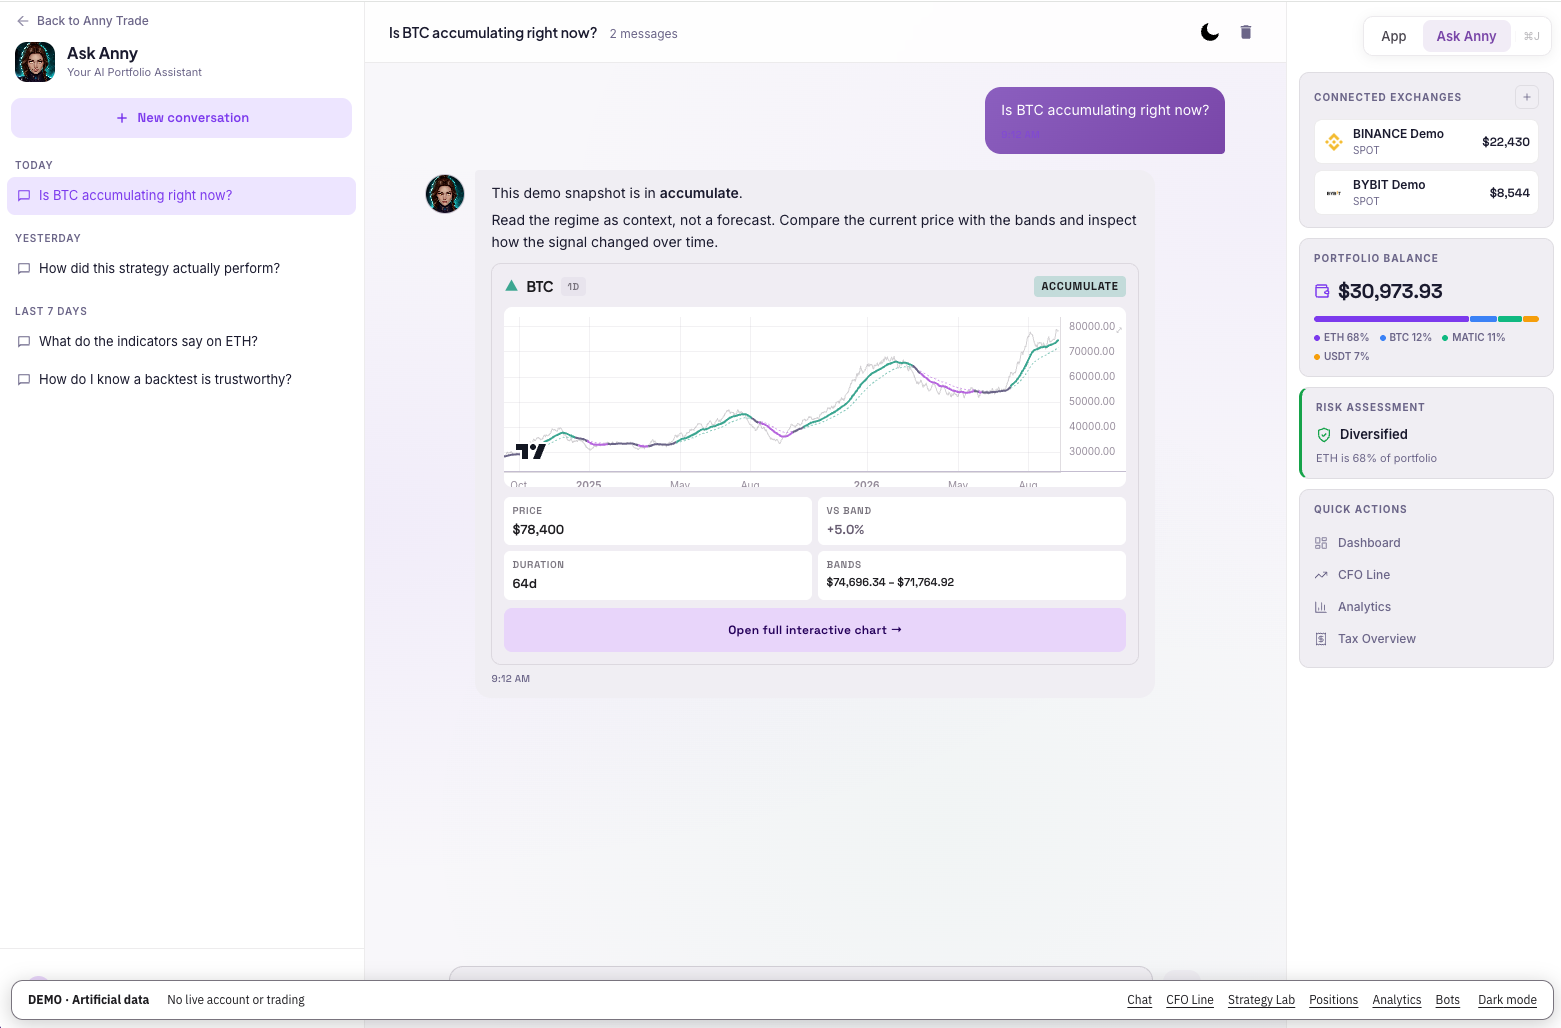
Ask about the market with the chart and portfolio context in the conversation.
Demo · Artificial data · View full size ↗Market intelligence · strategy lab · trading automation
Your crypto strategy partner. Read the market cycle, understand your portfolio, test ideas, and turn your rules into crypto trading bots.



Short live demo · uses your microphone
Connects to your exchange












 BTC / USDT
A return tells you what happened. The evidence helps you judge why.
Inspect the sample, the risk and what survived testing. No single metric proves that a strategy will keep working.
The CFO Line labels conditions Accumulate, Wait or Distribute. Inspect where a strategy traded, then check how its rules respond to those conditions.
An entry gate, position sizing and an exit rule do different jobs. A regime change does not automatically close every bot’s positions.
Trend and momentum favor accumulation. A strategy may require this regime before entering; check its actual rules.
24Trades in this regimeEvidence is mixed. Some strategies wait for alignment; others are designed for different conditions.
26Trades in this regimeTrend and risk conditions have weakened. Whether a bot reduces, exits or makes no change depends on its authorized rules.
8Trades in this regimeTrade counts show where activity occurred, not where the strategy will succeed next.
Read return alongside drawdown, trade count and risk-adjusted metrics. Select a metric to see what it measures and what it leaves out.
Compare the same sample and cost assumptions. These public cards do not document every fee, slippage or sampling assumption; inspect the full methodology before drawing conclusions.
Backtest start and end dates are not provided in this card.
Choose a test below to see how it separates finding settings from evaluating them. The timeline explains the method; it is not a validation result for the selected strategy.
A period used to repeatedly choose or revise a strategy is no longer untouched validation. These tests cannot eliminate trading risk.
Reserve a later period from parameter selection. Freeze the settings, then evaluate them on that reserved period.
Method illustration — not a strategy result
Choose settings on an earlier window, test them on the next window, then move forward and repeat. Inspect the sequence of held-out results.
Method illustration — not a strategy result
Apply the same fixed rules across historical periods. This helps reveal dependence on one favorable period, but is not per-window re-optimization or proof of unseen-data validation.
Method illustration — not a strategy result
Verified training/test dates are not supplied for this public example. No validation pass is implied.
Anny’s Optimizer compares combinations of entry filters, exit rules and risk settings. Strategy discovery can explore thousands of candidates. Individual runs report their own scenario count and compare the selected configuration with the baseline.
The best candidate in a search is not the best possible strategy. Searching more combinations creates more chances to fit historical noise; further validation still matters.
Compare conditions that allow an entry: confirmations, trend filters and market-regime rules. Available choices depend on the strategy.
Compare supported exit conditions, targets and stops. A backtested setting is not necessarily available for live execution; inspect compatibility before applying it.
Compare supported sizing and risk settings within the account’s capabilities. A lower-risk historical result does not remove the risk of loss.
This is an explanation of the search, not an optimization run. Open the Optimizer to inspect a run’s scenario count and before/after results.
Explore the OptimizerHistorical simulations are not a promise of future performance.
Research methodology DOT1hShortmediumPremiumDegrading
 DOGE1hShortmediumPremium
 ADA4hShortmediumPremiumDegrading
 SUI1hShorthighPremiumDOGE1dShorthighDOT4hShorthighPremium
Sign in when you want to save the configuration or continue to bot setup.
Create buy and sell strategies based on conditions you define, including the CFO Line market regime. Once enabled, a Bot can submit trading instructions within that configuration without separate confirmation for each trade.
The connected Exchange processes and executes the resulting orders. Trading permissions can change your holdings and cause losses even when withdrawal permissions are disabled.
Build a strategyMove between market conditions, portfolio analysis, positions, strategy research, Bots, and performance analytics without losing context. Ask Anny from the market, position, or strategy you are inspecting.
Ask about the market with the chart and portfolio context in the conversation.
Demo · Artificial data · View full size ↗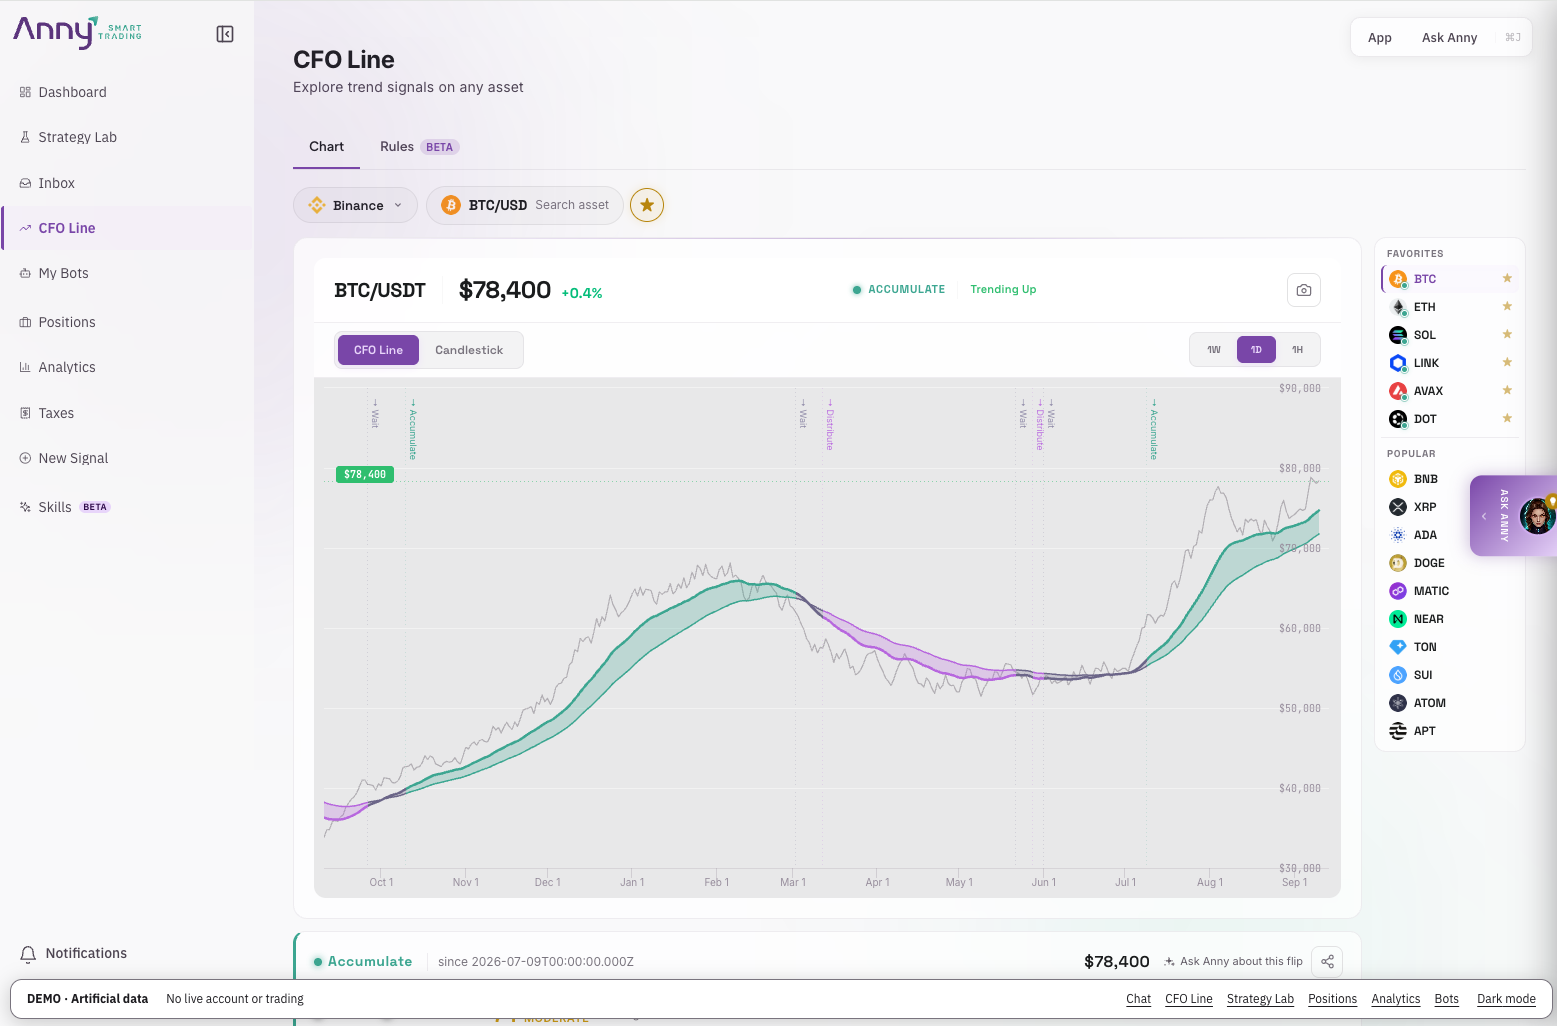
Read the CFO Line alongside market regimes, intervals, and your watchlist.
Demo · Artificial data · View full size ↗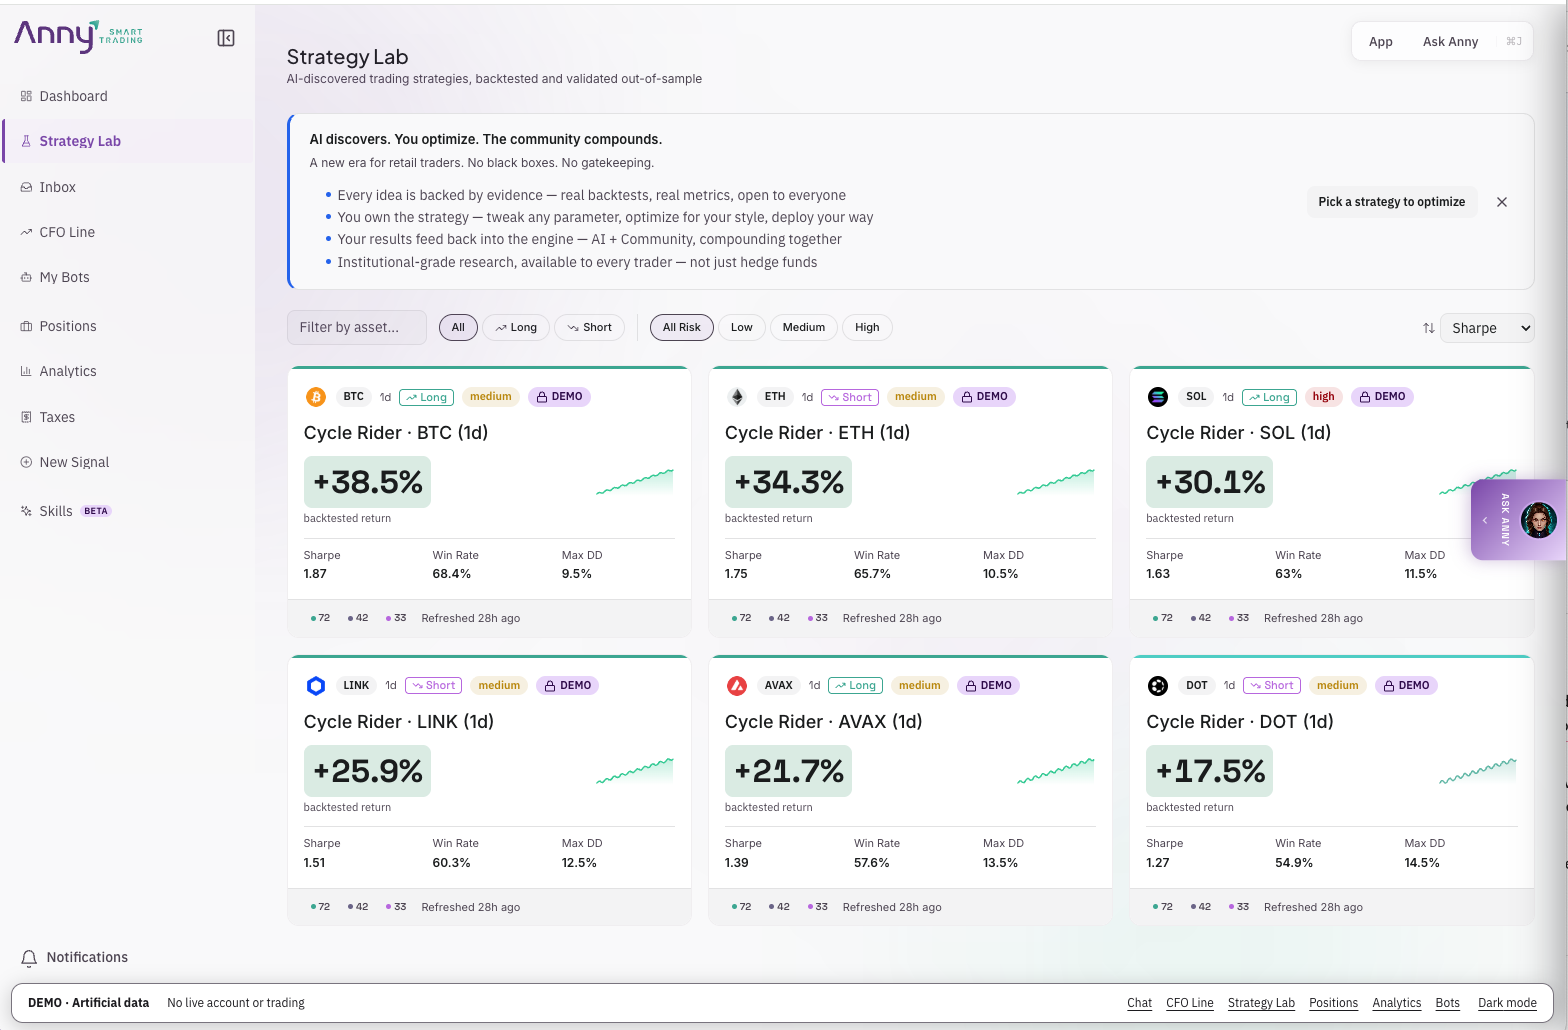
Compare strategy cards with return, drawdown, Sharpe, and win rate in view.
Demo · Artificial data · View full size ↗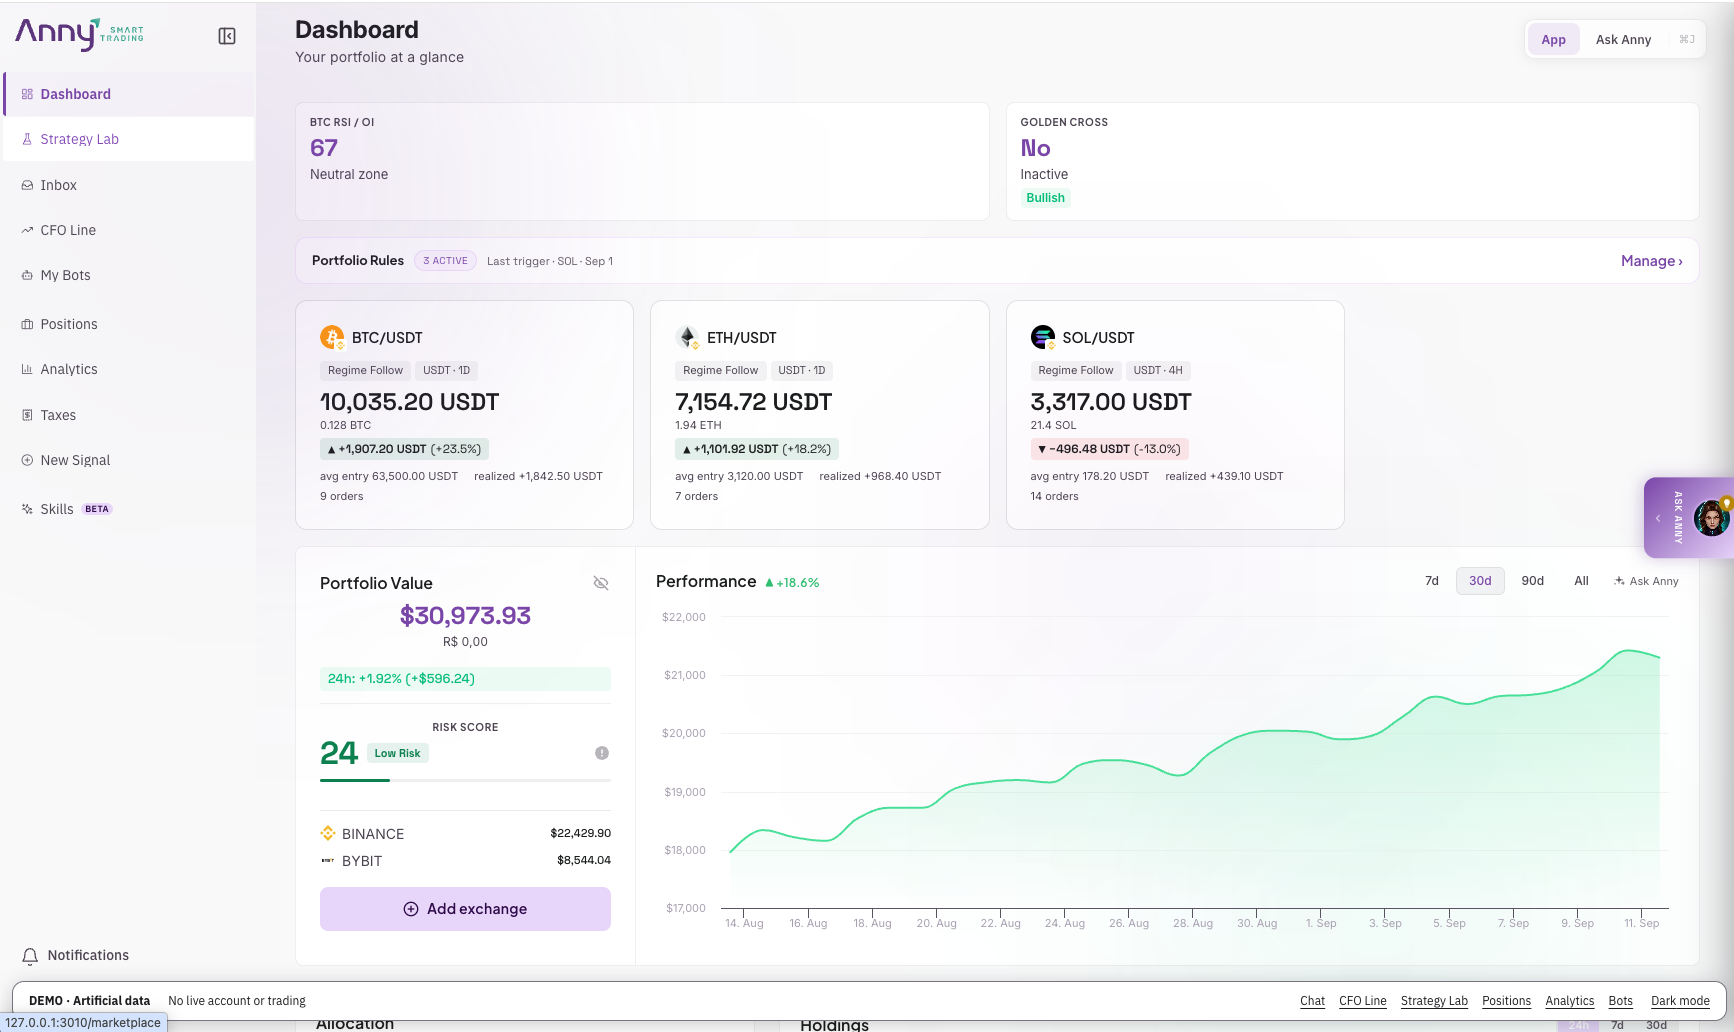
Move from your portfolio overview to individual assets and connected exchanges.
Demo · Artificial data · View full size ↗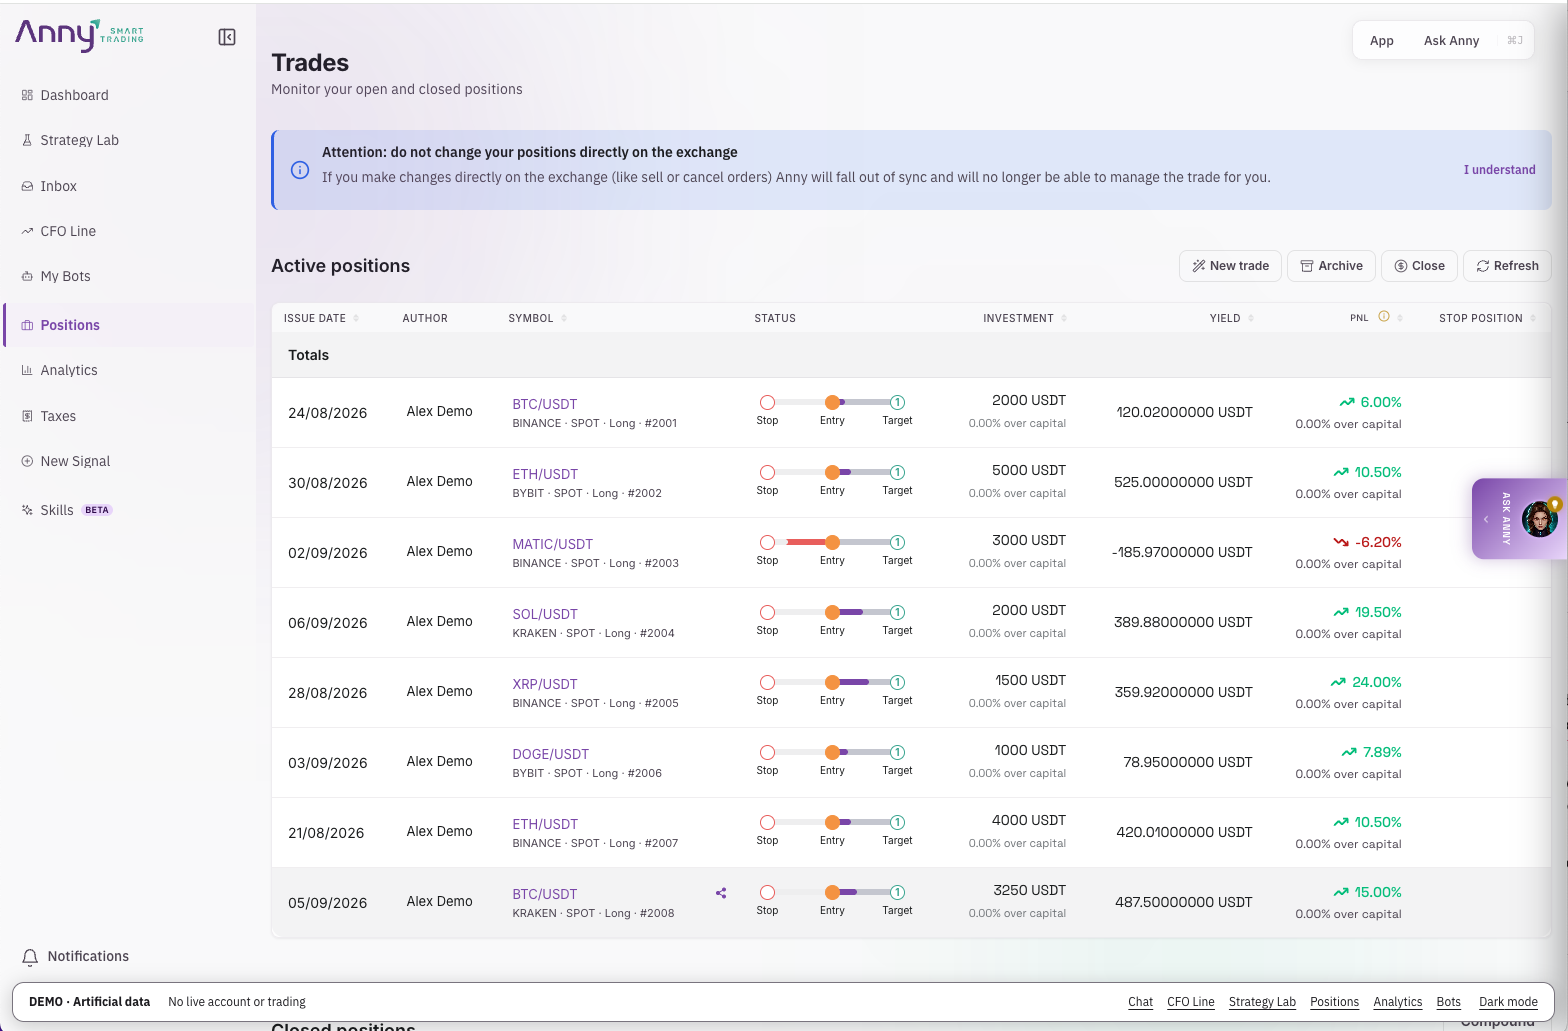
Keep entries, targets, exposure, and position status in view.
Demo · Artificial data · View full size ↗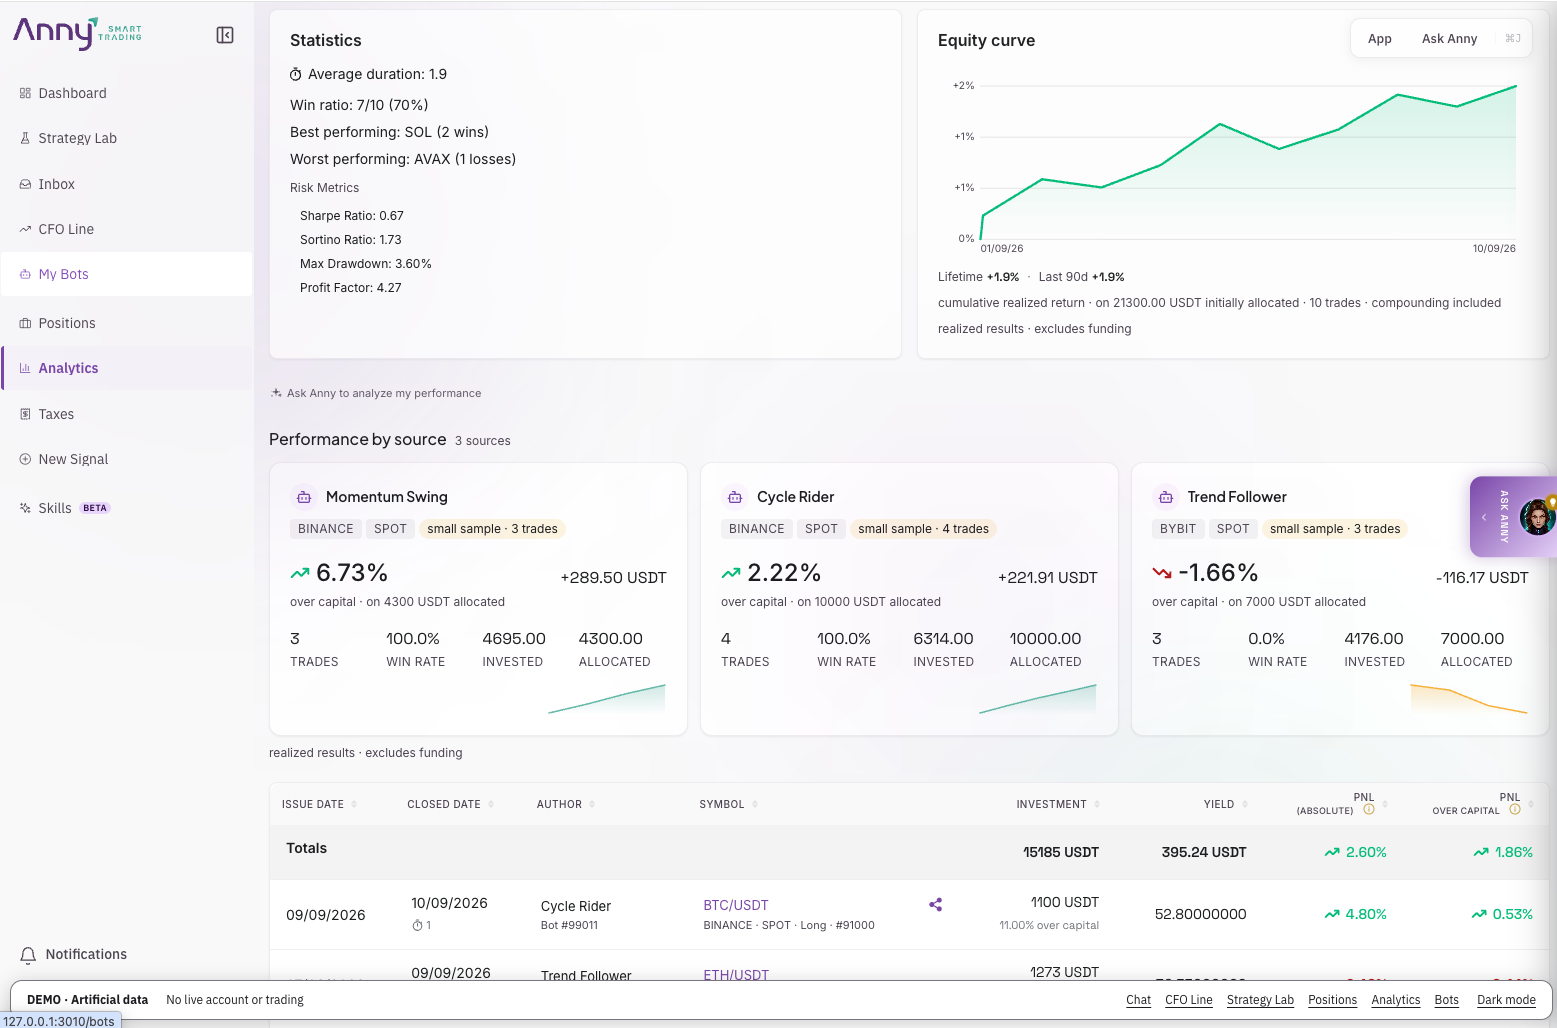
Inspect the equity curve, risk metrics, and performance by strategy.
Demo · Artificial data · View full size ↗When you start matters. Compare the CFO rule with buying and holding the same asset, from two investment starting moments.
Historical simulation snapshots
Investment starting
Starting in the bull cycle
Results through
| CFO rule | +34.0% |
|---|---|
| Buy & hold | +12.0% |
Max drawdown

Results through
| CFO rule | +94.4% |
|---|---|
| Buy & hold | -5.0% |
Max drawdown

Results through
| CFO rule | +51.0% |
|---|---|
| Buy & hold | -35.9% |
Max drawdown
Investment starting
Starting from the first buy
Results through
| CFO rule | +162.6% |
|---|---|
| Buy & hold | +262.3% |
Max drawdown
Results through
| CFO rule | +227.3% |
|---|---|
| Buy & hold | +60.7% |
Max drawdown
Results through
| CFO rule | +421.7% |
|---|---|
| Buy & hold | +348.2% |
Max drawdown
Return bars share one scale: −50% to +450%. The vertical marker is zero.
Max drawdown is the largest peak-to-trough decline during the simulation. Closer to zero means a smaller decline.
Historical simulations are not actual trading returns or a promise of future performance. A rule can reduce drawdown and still return less than buy-and-hold.
Transcribed from the CFO rule Evidence screens supplied on September 12, 2026. The displayed end dates are September 10 for BTC and September 11 for ETH and SOL. These are fixed snapshots, not a live performance feed.
Each starting moment keeps its own return and drawdown figures. Complete rule settings, fee and slippage assumptions are not included in the supplied screenshots, so these figures alone do not reproduce the simulation. The market links open the current public CFO Line, not a saved replay of these rules.
Your trading assets remain in your connected Exchange account. Read permissions support connected-account analysis. Trading permissions allow Anny to submit the instructions you authorize. Anny does not request withdrawal permissions.
Explore Strategy Lab and guest chat before account setup. Start a 30-day Pro trial when you want to use personal portfolio features, save strategies, or configure automation.
Less than one bad trade. Less than one missed regime change.
For active traders
Full intelligence suite — unlimited everything
Credits are consumed each time you use an AI feature. Cost depends on the feature and how much the AI processes.
| Feature | Credits |
|---|---|
| AI Features (varies by usage) | |
| Ask Anny (chat) | Varies |
| AI Insights | Varies |
| Deep Research | Varies |
| Backtesting (fixed per run) | |
| Backtesting | 100 |
| Portfolio Backtest | 200 |
| Strategy Optimizer | 900 |
| Walk-Forward Analysis | 1,800 |
"Varies" = billed by actual token usage. A short question costs less than a deep portfolio analysis. You can see the exact cost of each response via the ⓘ icon next to it.
Your plan includes a monthly credit refill. Purchased credits are added on top and never expire.
Anny Trade is crypto portfolio intelligence and user-directed trading-automation software. It analyzes available market and portfolio data, backtests strategy rules, and can submit authorized trading instructions to connected Exchanges.
The CFO Line weighs trend, momentum, and volatility to label market conditions Accumulate, Wait, or Distribute. It is a regime gate, not a price forecast.
Anny is an analysis and strategy platform that also supports user-configured Bots. You can use public analysis and read-only account features without enabling trading access.
Available checks include historical backtesting, hold-out testing, walk-forward analysis, parameter comparison, and degradation monitoring. These checks describe historical behavior; live results may differ materially.
No. Anny does not request withdrawal permissions. Trading access, when you authorize it, is different: it allows instructions that can change holdings and result in losses.
See the current supported-Exchanges list. Supported assets depend on the connected Exchange and product feature. See supported exchanges
The selected paid plan renews at its displayed billing interval unless canceled before renewal. Current prices, limits, and renewal terms are shown in the plans.
Yes. Backtests describe historical simulations, and automated trading can produce losses. Trading still involves risk when assets remain with the connected Exchange.
Yes. You can have a real-time video call with Anny's AI avatar on the Anny website. Speak through your microphone and hear Anny respond while her avatar appears on screen. Ask about trading strategies, backtesting, supported exchanges, and how Anny works. You are talking to AI, not a human adviser.
Choose the call button on the homepage, allow microphone access, and start speaking. A limited guest demo is available without signing up. You can also type in the chat. The public demo cannot read your private portfolio or activate a trading bot; account features require signing in and the relevant permissions.
Read the market. Inspect the evidence. Set your rules. Decide whether to automate them.

Campinas, SP, Brazil
CNPJ: 13.234.093/0001-60