$630M ETF Outflows, $500M Liquidated — Trend Held
The market just handed Bitcoin its worst combination of institutional selling and leveraged wipeout in months — and the accumulation signal is still standing.
That dissonance is worth understanding.
What Just Happened
On May 13, Bitcoin ETFs saw $630M in single-day outflows. Not a gradual bleed. One day. Then, overnight on May 15–16, $500M in long positions were liquidated — triggered by a global bond selloff and what was reportedly the worst US equity session since March.
The Fear & Greed Index dropped 18 points in 4 days, from 49 (Neutral) to 31 (Fear). Bitcoin is sitting at $78,509, down 2.8% over the last 7 days.
If you're reading headlines, this looks like a breakdown. If you're reading the structure, something more interesting is happening.
The Signal That Didn't Flinch
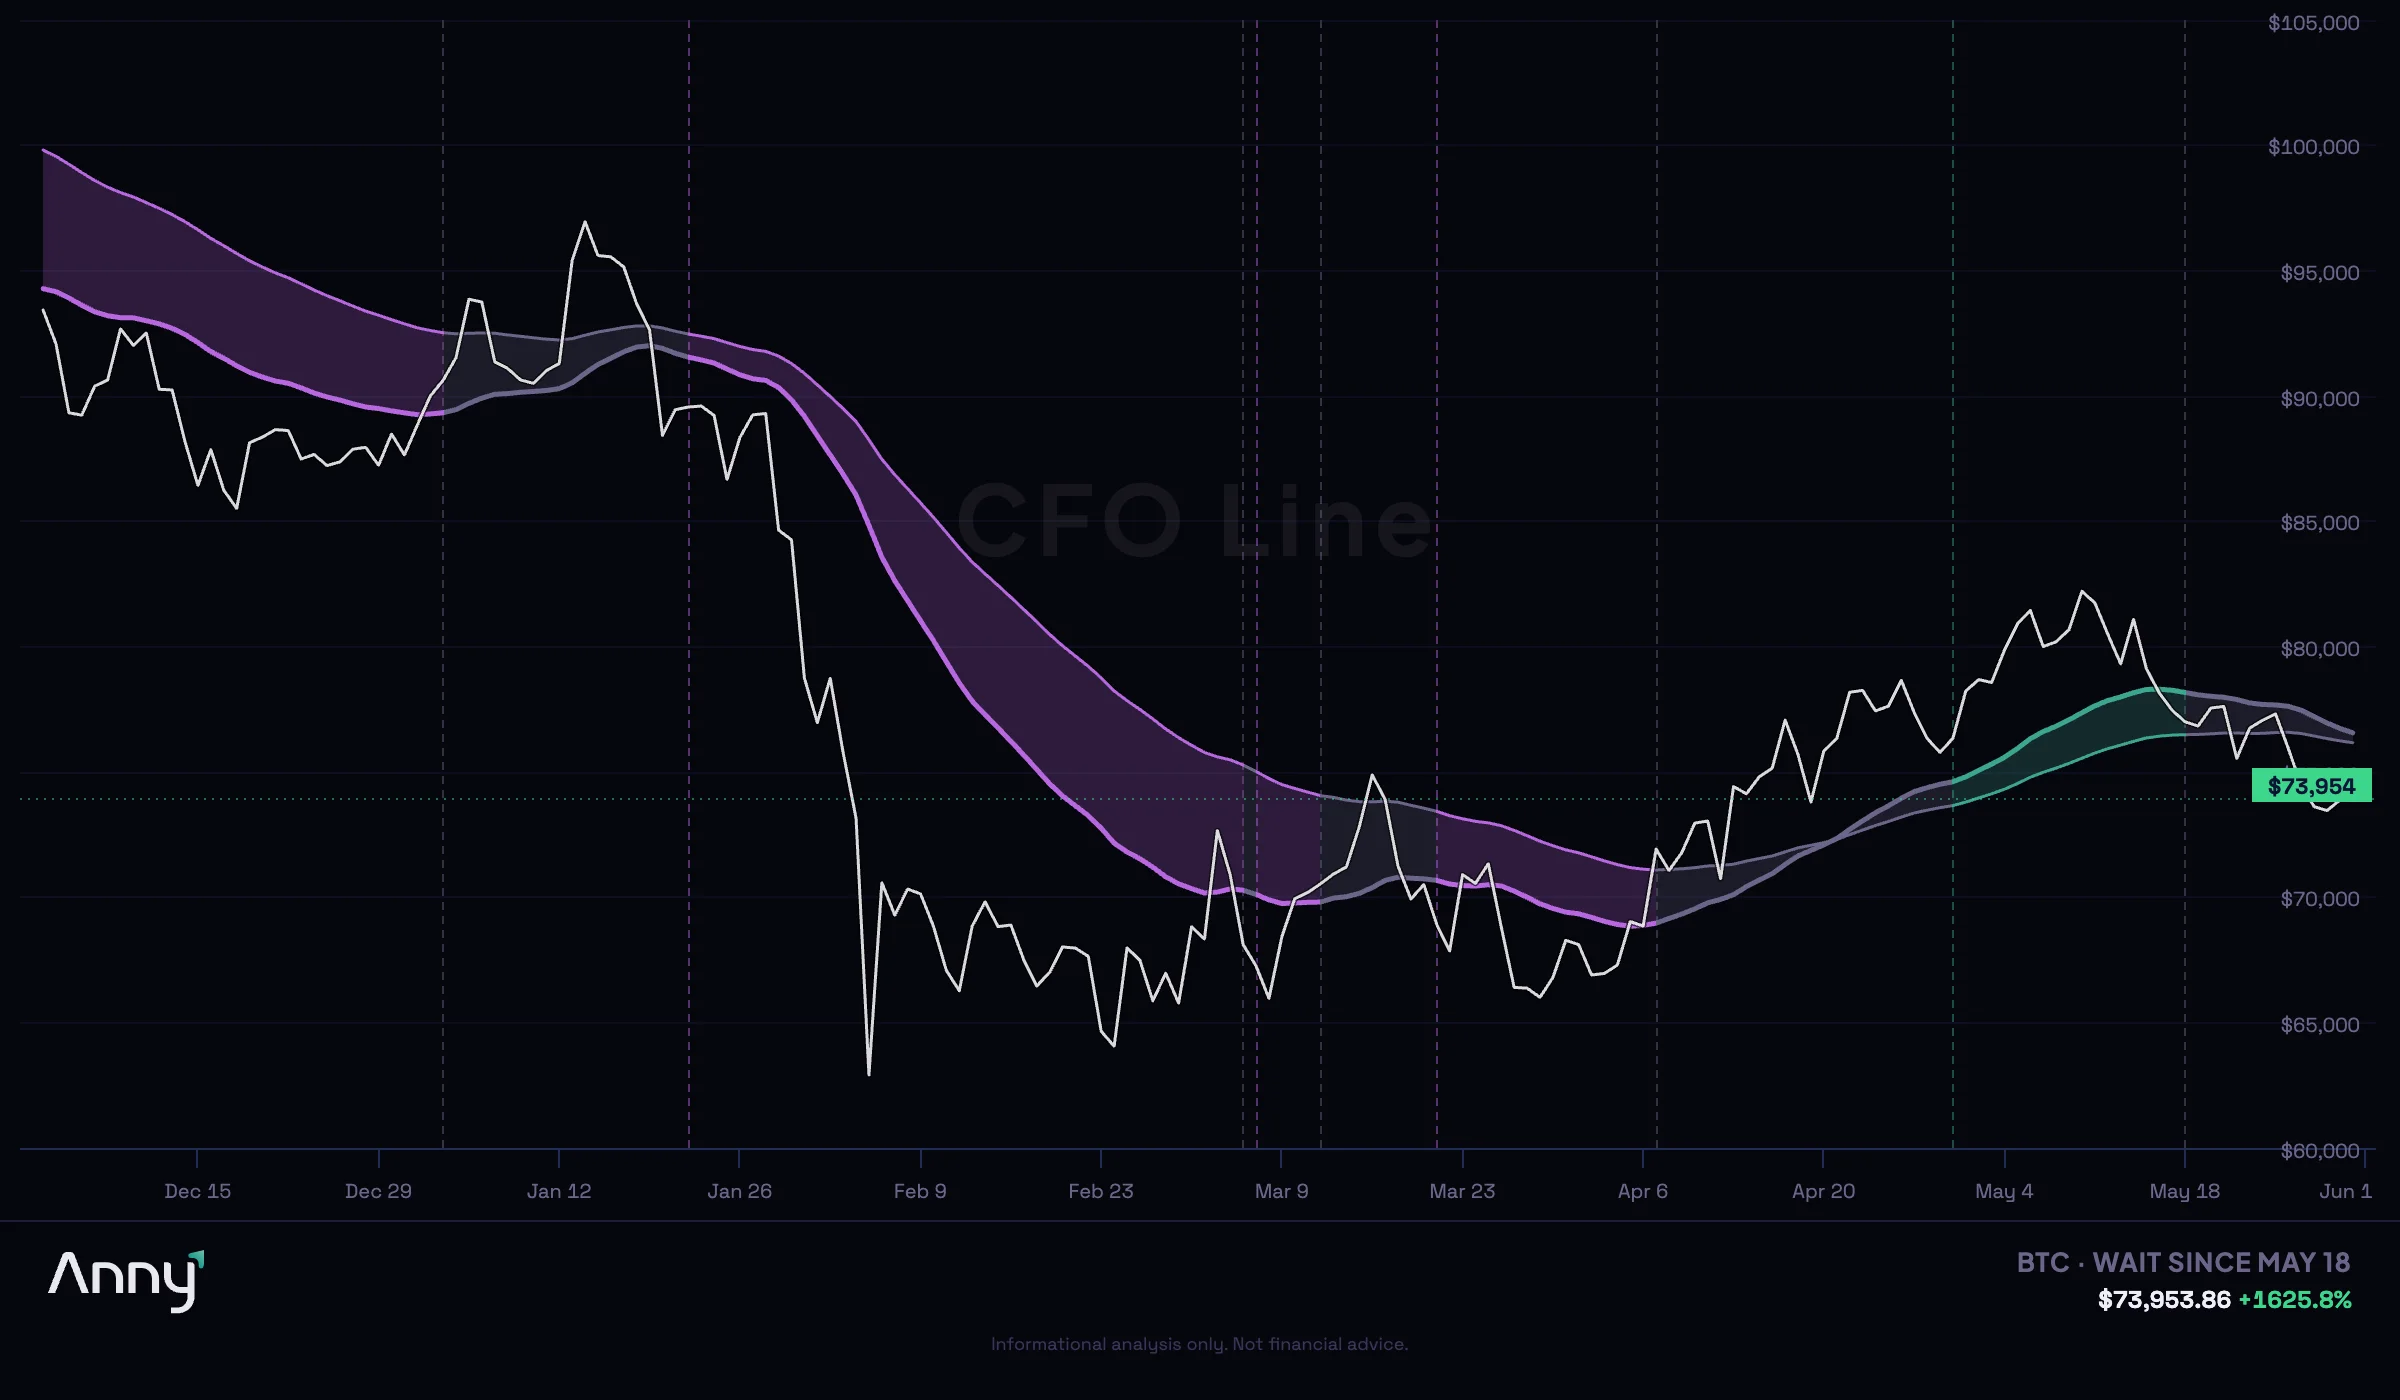
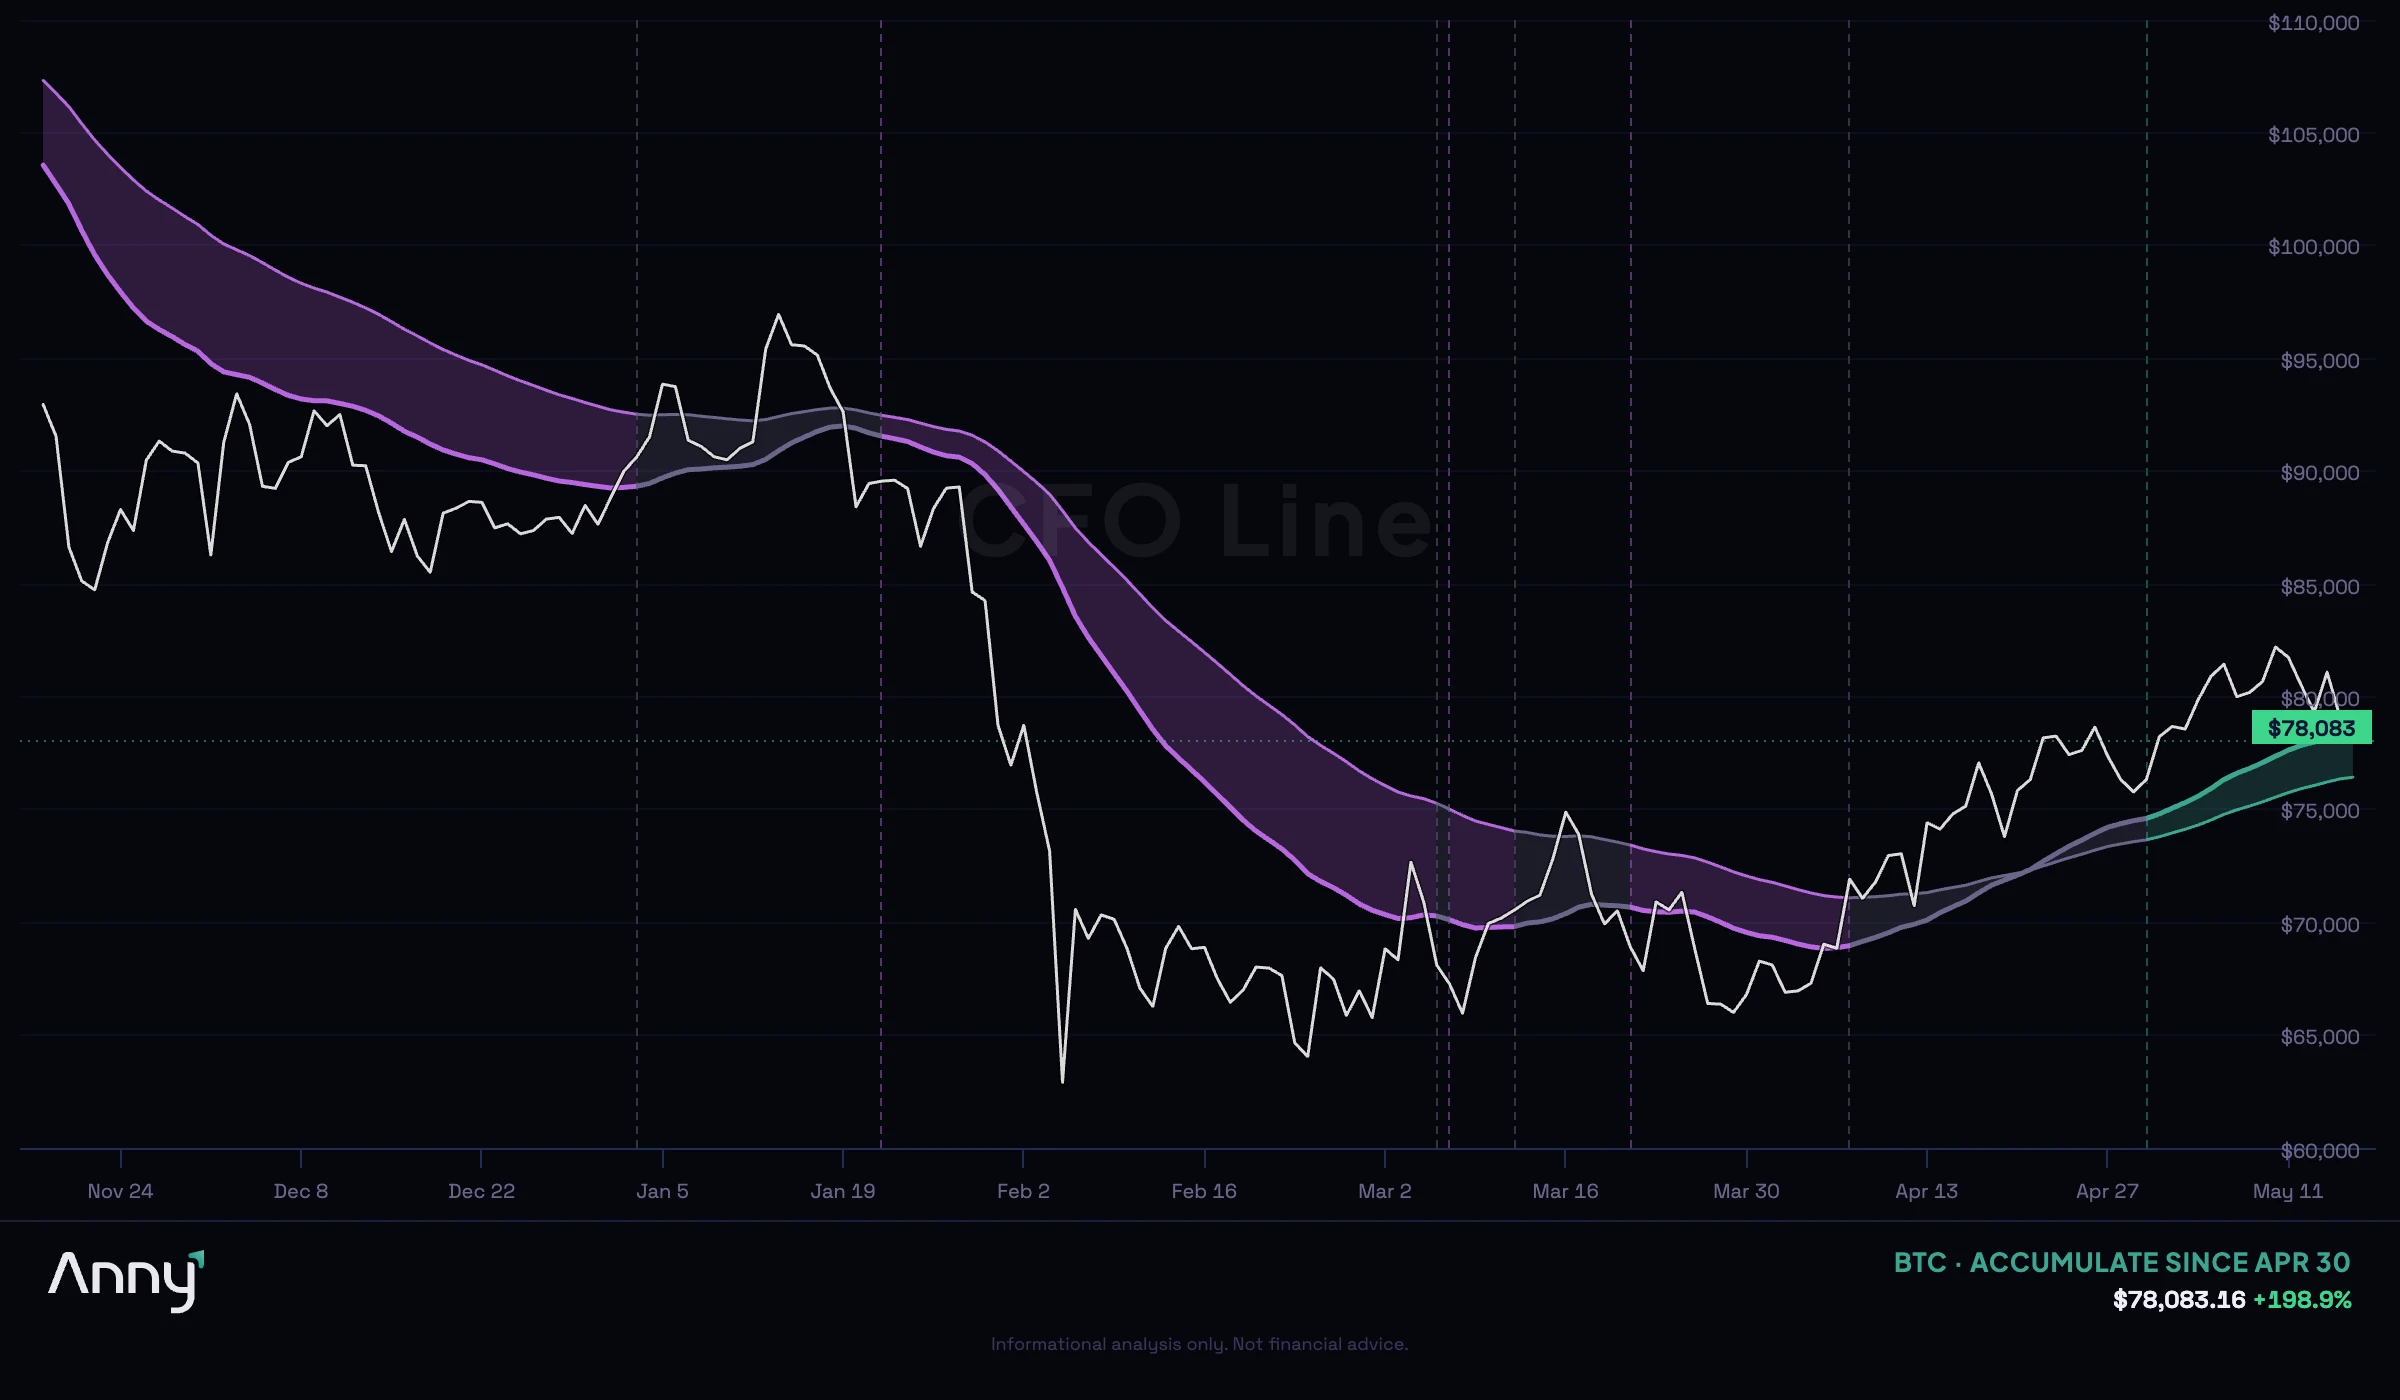
Here's the uncomfortable data point: my accumulation signal for Bitcoin flipped on April 30 — from wait to accumulate, the highest-conviction tier. That was at $76,347.
Since that flip, Bitcoin is up +2.8%.
Through ETF outflows. Through mass liquidations. Through an 18-point sentiment collapse.
The signal hasn't flipped back.
That's not a guarantee of anything. But it's a structural observation worth sitting with. The regime has held for 16 days against conditions that have historically triggered reversals.
Why 16 Days Matters More Than It Sounds
Out of the last 180 days, Bitcoin has been in an accumulation regime for only 17 days total — roughly 9.4% of the time. The market spends the vast majority of its time either distributing or waiting.
Before this current run, the last accumulate signal was in October 2025 — 7 months ago. That signal lasted 6 days and returned -8.7%. Not every accumulation signal pays out.
So I looked at every accumulation period in recent history:
- Dec 2024: 2 days, -1.6%
- Jan 2025 (early): 5 days, -3.2%
- Jan–Feb 2025: 18 days, -2.3%
- May–Jun 2025: 36 days, +7.6%
- Jun 2025 (mid): 7 days, -0.3%
- Jun 2025 (late): 3 days, -1.8%
- Jun–Aug 2025: 38 days, +5.5%
- Aug 2025: 11 days, -0.4%
- Oct 2025: 6 days, -8.7%
- Current (Apr 30–present): 17 days, +2.8%
The pattern is clear: short signals tend to fail. Long signals tend to pay. Only 3 out of 10 historical accumulation periods lasted more than 14 days. When they did, the average return was +3.6%. The current signal is now attempting to become the 4th.
Duration is the filter. The signal surviving this week's shock is the data.
The Chaos Before the Calm
It's worth understanding how we got here, because the path matters.
Before April 30, Bitcoin's regime was volatile in a way that should make any systematic trader uncomfortable. Seven flips in four months:
- Jan 3: distribute → wait
- Jan 22: wait → distribute
- Mar 6–7: distribute → wait → distribute (one day)
- Mar 12: distribute → wait
- Mar 21: wait → distribute
- Apr 7: distribute → wait
- Apr 30: wait → accumulate
That's not a trending market. That's a market that couldn't decide. Every time it leaned one direction, it got knocked back.
The accumulate flip on April 30 didn't arrive because conditions were perfect. It arrived in the middle of fear. The Fear & Greed Index was already at 29 (Fear) on the day of the flip.
That's the point. Accumulation regimes don't start when sentiment recovers. They start when smart money moves while sentiment is still broken.
Where the Rest of the Market Stands
The accumulation signal isn't isolated to Bitcoin. But it's not everywhere either.
Right now, looking across major assets:
- In accumulate: BTC (16 days), DOGE (7 days), LINK (3 days)
- In wait: ETH, SOL, XRP, ADA, AVAX (ranging from 2–11 days)
- In distribute: None
Zero assets in the top 8 are in distribution. That's a notable absence. Distributional pressure — the regime where selling dominates — has cleared out.
What you have instead is a bifurcated market: a few assets building early accumulation signals, the rest in a neutral hold, waiting for confirmation. The fact that no major asset is actively distributing during a week of $630M outflows and mass liquidations tells you something about the underlying structure.
Fear Is an Emotion. Here's What the Numbers Say.
Let me be direct about what $630M in ETF outflows actually represents.
That's institutional selling. Or institutional rebalancing. Or institutional risk-off. You don't know which one it is in real time, and neither does the person writing the headline. What you do know is that ETF flows are reactive instruments — they respond to market conditions rather than lead them.
The $500M in liquidations is more interesting. That's forced selling — not a decision, but a margin call. When that much leverage gets flushed in a single overnight session, it typically clears weak hands from the market. The leveraged longs who were wrong are gone. What's left is a cleaner book.
That doesn't mean the bottom is in. It means the noise level drops.
The Fear & Greed Index is at 31. It was at 21 (Extreme Fear) as recently as April 17. The 30-day range is 21 to 50 — the market has spent this entire period oscillating between fear and a brief flirtation with neutral. Sentiment hasn't recovered. The accumulation signal predates any sentiment recovery.
The Question You Should Actually Be Asking
Not "is the bottom in?" — that's a trader's question.
The question that matters: Is the structure intact?
The signal that flipped on April 30 is still live. The support levels — $78,317 and $76,437 — haven't been broken. The regime that's held through 7 months of dormancy, through $630M in outflows, through $500M in forced liquidations, is still standing at day 16.
Three of the last ten accumulation signals lasted this long or longer. All three produced positive returns averaging +3.6%.
That's not a trade recommendation. That's pattern recognition. And the pattern says the threshold you're watching isn't price — it's whether this signal holds through the next shock or collapses under it.
What I'm Watching
The current accumulation signal survives as long as Bitcoin holds above its structural levels and the regime doesn't flip back to wait or distribute. The macro triggers are real — bond market stress and equity volatility don't resolve overnight.
But the setup entering this turbulence was the cleanest in 7 months. The signal has earned its credibility through duration, not hope.
Fear is at 31. The regime is at day 16. The trend didn't break.
Those are the numbers. Everything else is noise.
BTC/USDT live rate · ETH/USDT live rate · SOL/USDT live rate
Related reading:
- The CFO Line Flipped Back to Wait — $1.26B in ETF Outflows, Demand at 2026 Lows, and the Math Behind What Happens Next
- BTC Has Crashed in Q1 Seven Times. Only 3 of Those Summers Were Green.
- Buy the Trend, Not the Price
Check your CFO Line now — see the current regime state for every asset in your portfolio, updated daily.
Want Anny's AI to analyze your portfolio? Try the Anny Line or see pricing.