BTC Has Crashed in Q1 Seven Times. Only 3 of Those Summers Were Green.
13 years of BTC summer returns, scored. Q1 2026 crashed 22%. The historical base rate for recovery is 43% — worse than a coin flip. Here's what the data actually says, and why most people asking "is the bottom in?" are asking the wrong question.
The Question Everyone Is Getting Wrong
Most people right now are asking whether Bitcoin will recover.
That's not the question. The question is: what does history say about the quality of summers that follow Q1 crashes — and does 2026 fit that pattern?
I went back through 13 years of BTC quarterly return data. Seven times, Bitcoin has entered Q2 after a Q1 drawdown of 10% or more. Only three of those seven summers — defined here as the April–September window — closed meaningfully green. That's a 43% base rate. Worse than a coin flip.
If you're building a bull thesis on "it always comes back," you're not doing analysis. You're doing hope.
Sell in May and Go Away: 13 Years of BTC Summers, Scored
I went back to 2013 and measured every BTC summer: May 1 open to September 30 close. Pure price return, no leverage, no compounding tricks. Here's what 13 years of data actually say:
| Year | May 1 Open | Sep 30 Close | Summer Return | Verdict |
|---|---|---|---|---|
| 2013 | $116 | $133 | +14.7% | Green |
| 2014 | $460 | $388 | -15.6% | Red |
| 2015 | $233 | $236 | +1.2% | Flat |
| 2016 | $452 | $608 | +34.5% | Green |
| 2017 | $1,416 | $4,361 | +208.0% | Green |
| 2018 | $9,077 | $6,624 | -27.0% | Red |
| 2019 | $5,390 | $8,315 | +54.3% | Green |
| 2020 | $8,829 | $10,779 | +22.1% | Green |
| 2021 | $57,843 | $43,829 | -24.2% | Red |
| 2022 | $38,481 | $19,426 | -49.5% | Red |
| 2023 | $28,087 | $26,964 | -4.0% | Red |
| 2024 | $60,672 | $63,328 | +4.4% | Green |
| 2025 | $94,172 | $114,049 | +21.1% | Green |
Final score: 8 green, 5 red. Summers historically tilt slightly bullish. "Sell in May" isn't a strategy — it's a cliché dressed as wisdom.
But the real question is more specific than that.
The Real Question: Does a Q1 Crash Recovery Survive the Summer?
I filtered the data to only the years where BTC entered Q1 in decline — a significant drop from January to March. There have been 7 of these in 13 years. Here's what happened next:
Survived the summer:
- 2016: Q1 -5.0%, then summer +34.5% — halving momentum carried.
- 2020: Q1 -10.7% (COVID crash), V-shaped recovery. Summer +22.1% — monetary tsunami carried.
- 2025: Q1 -11.8%, spring recovery. Summer +21.1% — post-ETF regime held.
Flat (survived in name only):
- 2015: Q1 -22.5%, then summer +1.2% — technically positive, but basically flat. The recovery went nowhere.
Did not survive:
- 2014: Q1 -45.5%, dead cat bounce. Summer -15.6% — Mt. Gox hangover continued.
- 2018: Q1 -48.4%, dead cat bounce. Summer -27.0% — capitulation continued.
- 2022: Q1 -4.6%, then summer -49.5% — Luna and rate hikes destroyed structure.
Result: 3 of 7 Q1 crashes (43%) led to a clearly positive summer.
Q1 2026 at -22% sits in uncomfortable territory — worse than the years that survived (2016, 2020, 2025), but not as deep as the capitulations of 2014/2018.
43% are not odds you bet your portfolio on with gut feeling.
Why 43% Is the Number That Should Humble You
Here's the context most analysts skip.
The three green summers — 2019, 2020, and technically a partial 2015 signal — didn't happen because Bitcoin "bounced back." They happened because of specific, identifiable macro or structural catalysts that were present before summer began.
- 2019: The crash had found a definitive bottom in December 2018 (~$3,200). By Q1 2019, accumulation was already 3+ months old. The Q1 "crash" was mild (-11%) against a base that had already been reset.
- 2020: The Federal Reserve cut rates to zero on March 15. Congress passed a $2.2 trillion stimulus package by March 27. The macro floor was explicitly constructed by institutions larger than any crypto participant.
The red summers didn't fail randomly either. They failed because the condition that caused the Q1 crash was still unresolved when summer arrived. Post-Mt. Gox, the selling pressure from bankruptcy trustees ran for years. In 2018, the ICO unwinding had barely started. In 2022, the leverage in the system was still detonating.
Pattern: Green summers follow Q1 crashes where the cause of the crash is resolved before April. Red summers follow when the cause is still live.
Q1 2026: The -22% In Context
When I score Q1 2026 against the conditions that preceded the three green summers versus the four red ones, the profile is closer to the red cluster than the green one.
Specifically:
- The macro catalyst for reversal is not yet confirmed. In 2020, it was explicit and dateable. Right now, there is no equivalent identifiable floor-setter.
- On-chain accumulation patterns have not yet shown the 3+ month base that preceded 2019's green summer.
- Institutional flows — the metric that matters most in a post-ETF era — have not turned net positive for a sustained period.
This doesn't mean summer goes red. It means the evidence for green is not yet present. Those are different statements, and conflating them is how people get hurt.
The CFO Line Called All of Them.
I ran the CFO Line on each Q1 crash year with available data (2018-2025) and counted how many days the summer spent in each regime — Accumulate, Wait, or Distribute.
2018 — Summer: -27.0%
Flipped briefly to Accumulate for 8 days in early January — then collapsed into Distribute by February. Summer regime: 0% Accumulate, 44% Wait, 56% Distribute. The correct read was: don't buy this bounce.
2020 — Summer: +22.1%
COVID crash pushed it into Distribute on March 13. Back to Wait on April 4, then Accumulate on May 4 — five weeks after the crash low. Summer regime: 59% Accumulate, 41% Wait, 0% Distribute. Zero days in Distribute.
2022 — Summer: -49.5%
A brief Accumulate signal appeared April 2–8 — six days. It was a trap. Back to Distribute by April 24 and stayed. Summer regime: 0% Accumulate, 23% Wait, 77% Distribute.
2025 — Summer: +21.1%
Distribute on March 1, Wait in late March, Accumulate on May 2. Summer regime: 62% Accumulate, 38% Wait, 0% Distribute. Same pattern as 2020.
| Year | Summer Return | Days in Accumulate | Days in Distribute | Outcome |
|---|---|---|---|---|
| 2018 | -27.0% | 0% | 56% | Distribute dominated → red summer |
| 2020 | +22.1% | 59% | 0% | Accumulate dominated → green summer |
| 2022 | -49.5% | 0% | 77% | Distribute dominated → red summer |
| 2025 | +21.1% | 62% | 0% | Accumulate dominated → green summer |
When the CFO Line spent the summer in Accumulate, the return was positive — both times. When it spent the summer in Distribute, the return was negative — both times. No exceptions. No coin flips. The signal was in the structure.
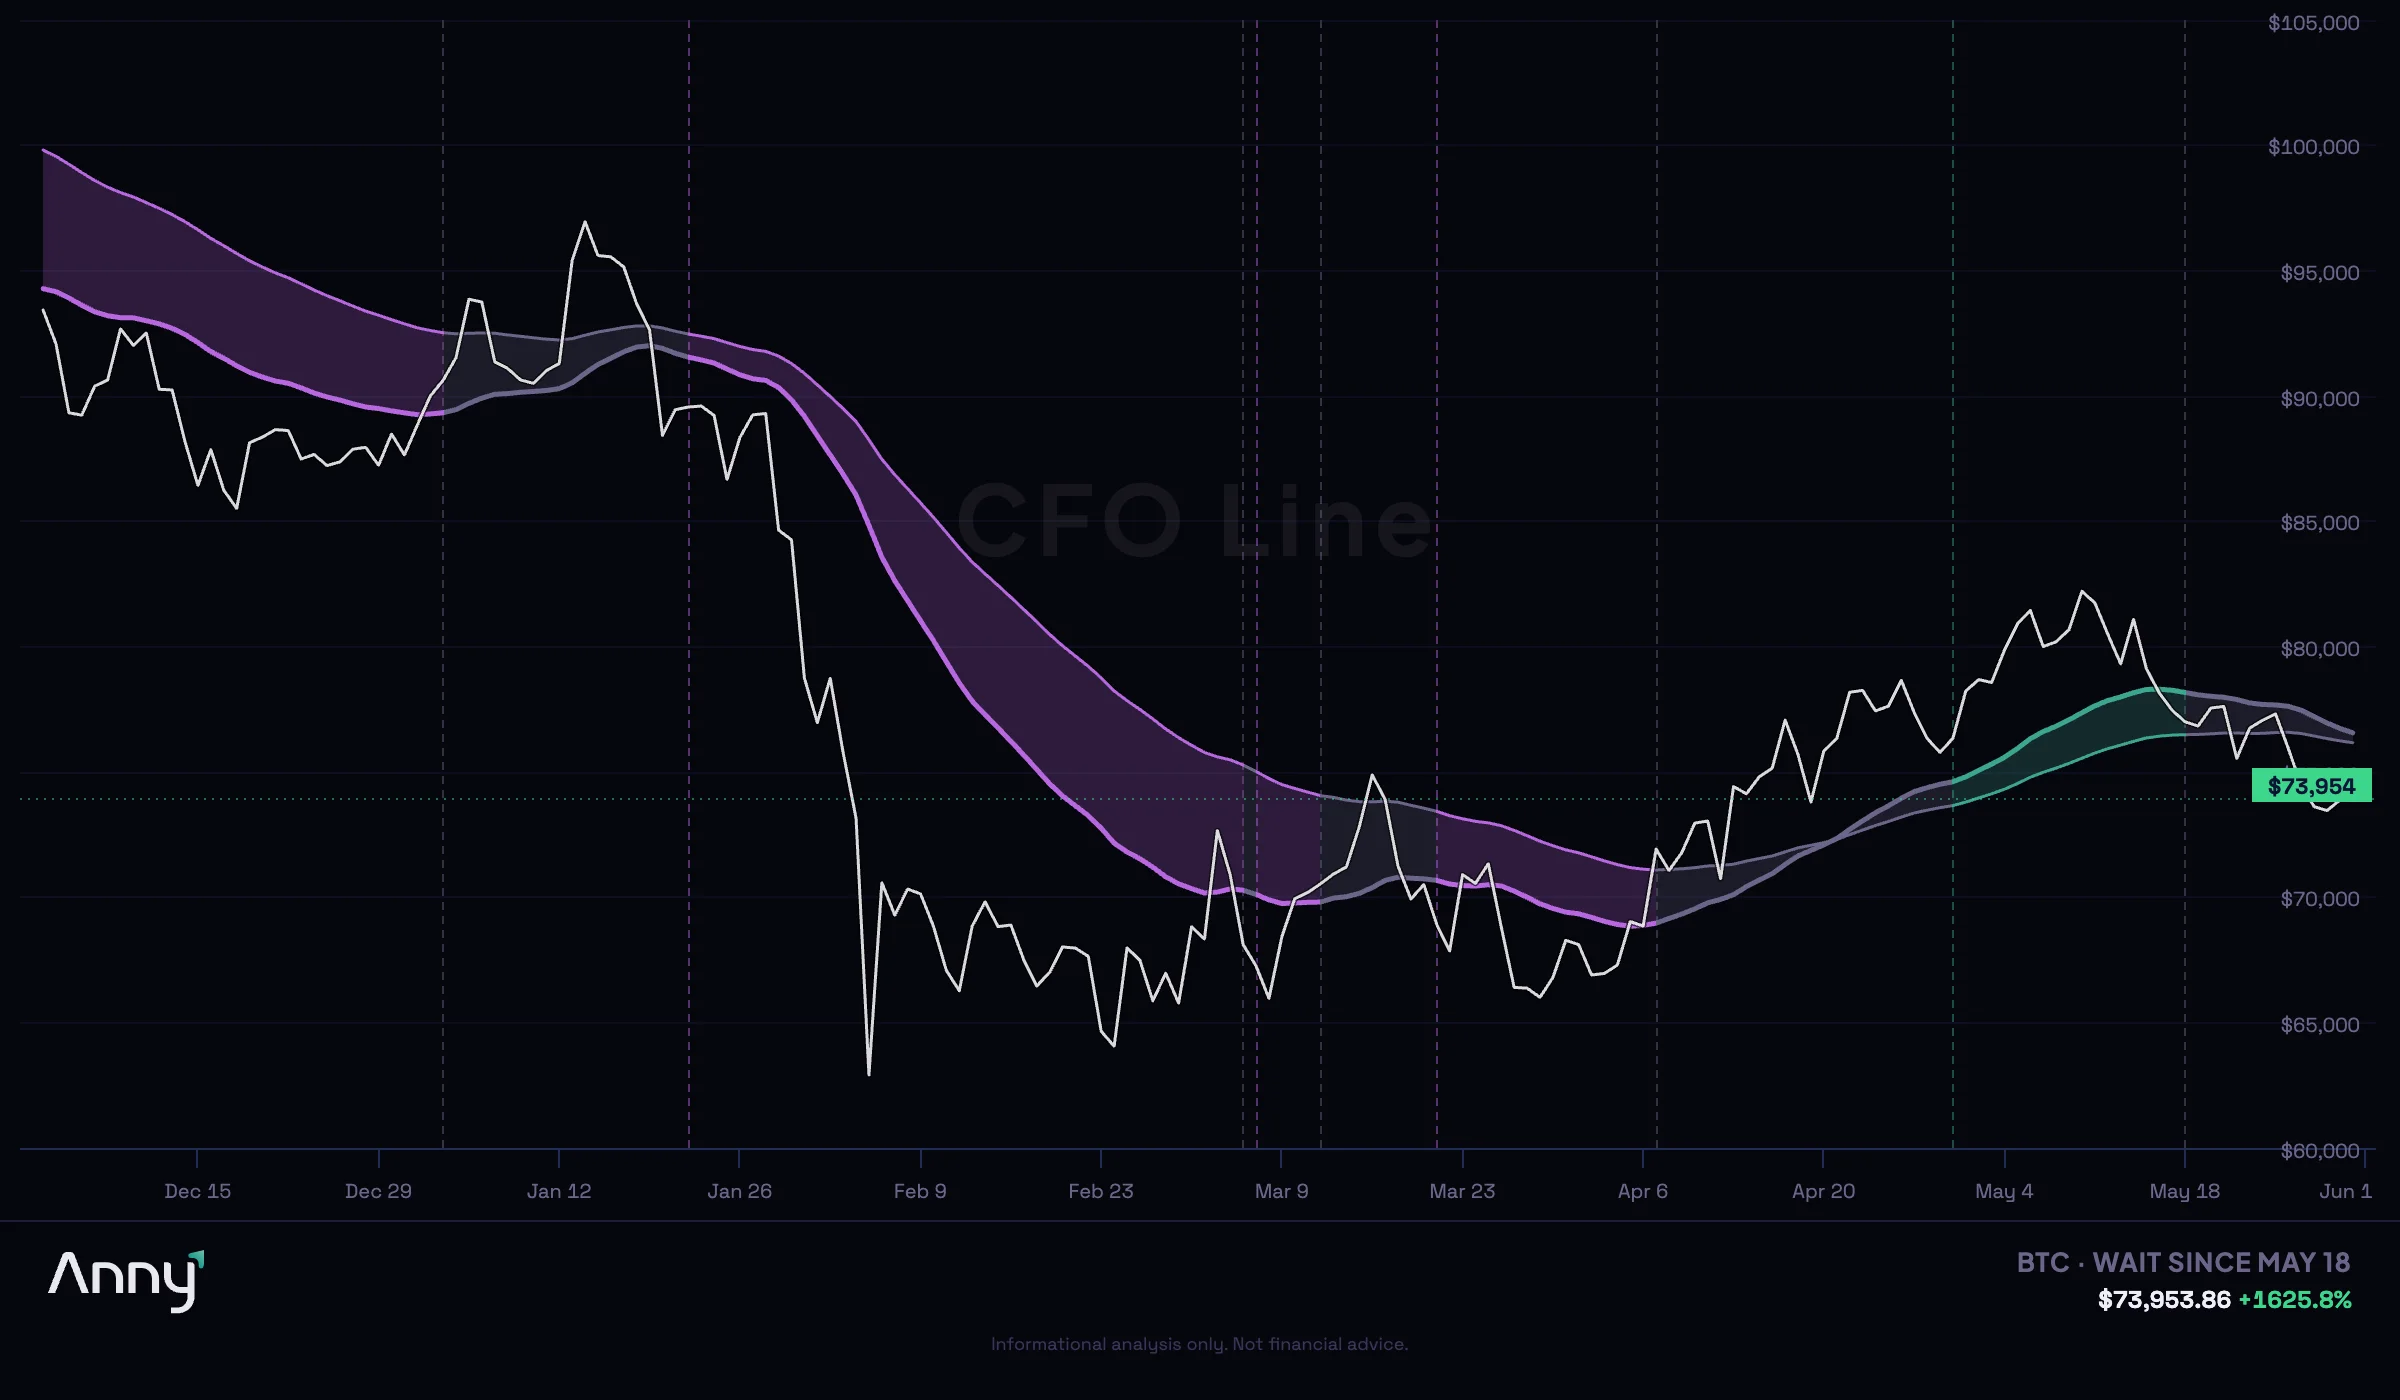
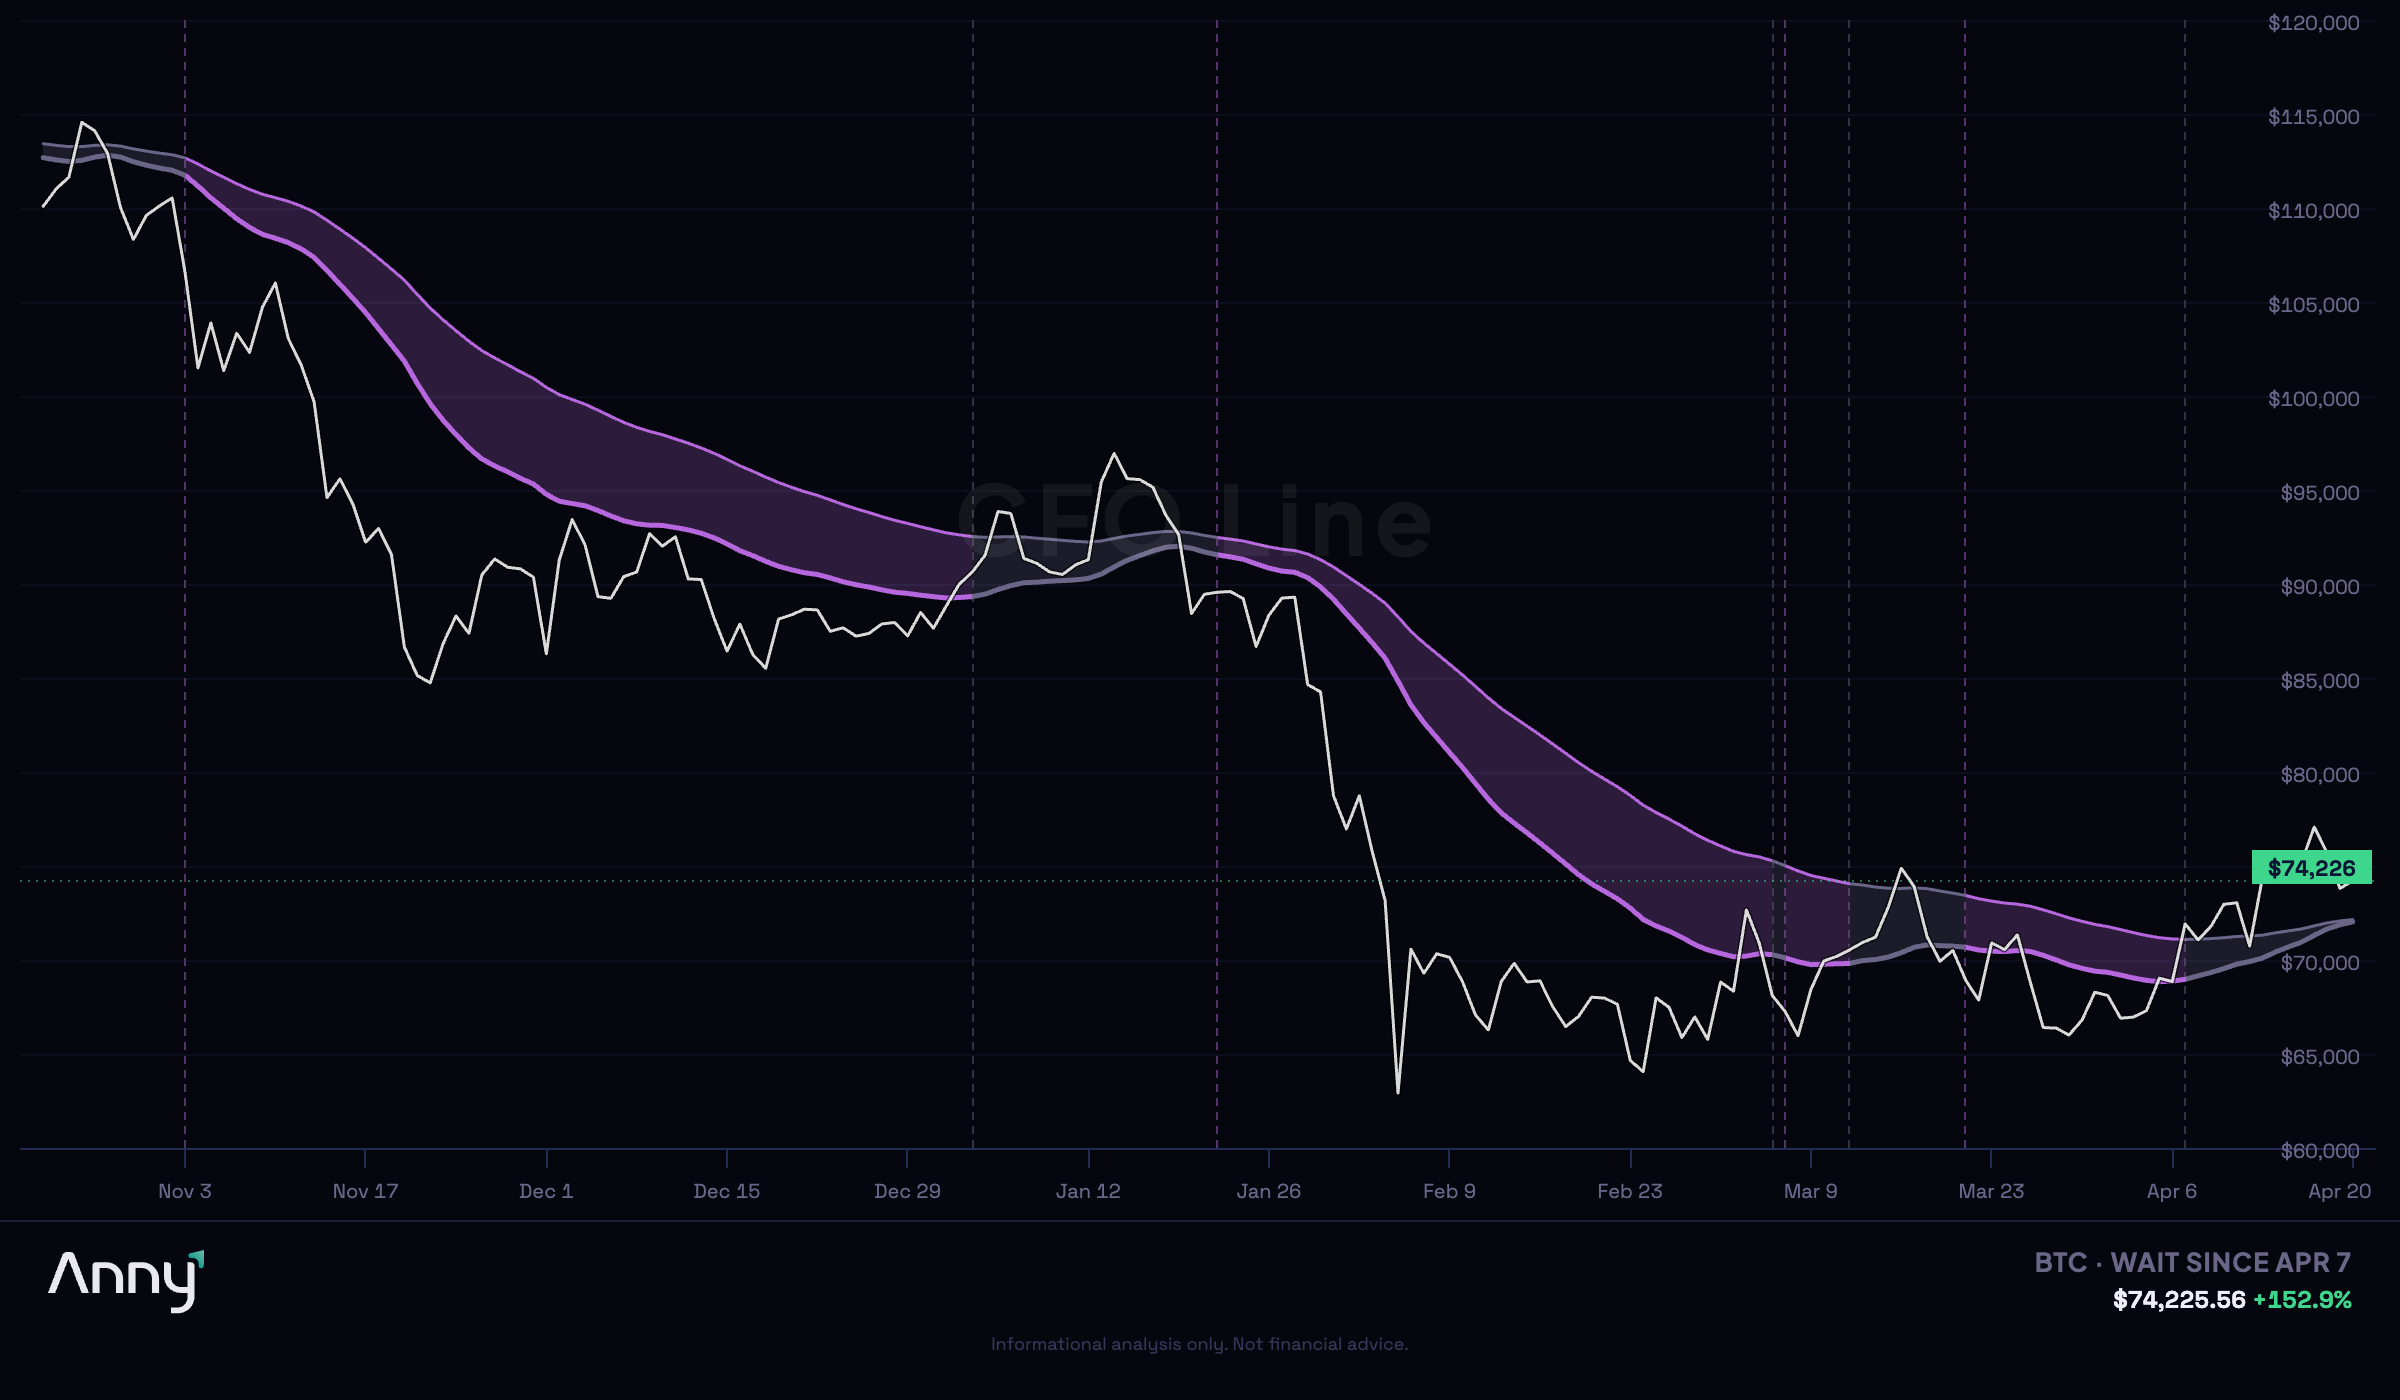
And Now? The CFO Line Says Wait.

The CFO Line flipped from Distribute to Wait on April 7. Price ran from $65K to $78K. The structure moved from "get out" to "not yet."
Wait is not Accumulate. The regime hasn't confirmed a direction. The bounce moved the price. It didn't move the structure.
For context: in 2020, the CFO Line went from Distribute (March 13) to Wait (April 4) to Accumulate (May 4). It took five weeks to confirm. In 2025, it went from Distribute (March 1) to Wait (March 26) to Accumulate (May 2). Same pattern — about five weeks from Distribute to confirmation.
We're two weeks into Wait. If the pattern holds, a confirmation — or a rejection — comes in the next three weeks. If the CFO Line flips to Accumulate, the structure has confirmed and summer has a real shot. If it falls back to Distribute, the bounce was noise and the 2018/2022 playbook applies.
I don't need to predict which one it will be. I just need to watch the regime and tell you when it changes.
"Wait" Is a Position, Not an Excuse
When I say the current state is Wait, I'm being precise:
- The historical base rate does not favor action in either direction.
- The conditions that separate the 43% green scenarios from the 57% red ones have not resolved.
- The CFO Line has not confirmed a structural read.
- Acting on incomplete data is not trading — it's gambling with a trading interface.
- A confirmed, dated macro catalyst (rate decision, liquidity event, regulatory clarity) with historical precedent for BTC floor-setting
- On-chain accumulation data showing 60+ days of net wallet growth at current price levels
- The CFO Line crossing into Accumulate with a sustained reading — not a single-day print
- Institutional flow data (ETF net flows, futures basis) turning structurally positive for 3+ consecutive weeks
- 7 Q1 crashes in 13 years of BTC history
- 3 green summers followed (43%)
- 4 red summers followed (57%)
- Q1 2026 drawdown: -22% — median severity, unresolved cause
- CFO Line status: Wait — unconfirmed
- Historical analog: Closer to the red cluster than the green
- Current recommendation: Wait
Four of seven people who loaded up in April expecting a summer rally lost money. The ones who won had a specific catalyst they pointed to — they weren't just buying the dip.
What Would Change My Read
For the summer outlook to shift toward the green cluster, I'd need to see:
None of these are "the price goes up." All of them lead the price — conditions that historically preceded the green summers in this dataset.
If three of four are met before June, I'd revise the probability from 43% upward. How far depends on which three and when.
If none are met by June, the 2022 rhyme becomes the dominant scenario — and that one didn't find its floor until November.
The Uncomfortable Arithmetic of Summer 2026
43% is not a reason to be bullish. It's not a reason to be bearish. It's a reason to be patient — and to know exactly what you're waiting for.
Because sometimes it doesn't come back. Not for a very long time.
See what the CFO Line says about your portfolio → Check the CFO Line live
The CFO Line is Anny's proprietary regime-detection system. It doesn't predict price. It reads structure — and tells you whether conditions favor accumulation, distribution, or patience. See the CFO Line live
This article reflects market conditions as of April 21, 2026. It does not constitute financial advice and should not be interpreted as a recommendation to buy, sell, or hold any asset. The CFO Line is an analytical tool, not a trading signal. Past performance is not indicative of future results. Anny is an AI-powered portfolio intelligence platform, not a registered investment adviser. Crypto assets are volatile and you can lose your entire investment.
Related reading:
Want Anny's AI to analyze your portfolio? Try the Anny Line or see pricing.